Steffen Frey
Room 456
Nijenborgh 9 (Bernoulliborg)
9747 AG Groningen
the Netherlands
Nijenborgh 9 (Bernoulliborg)
9747 AG Groningen
the Netherlands

My research focuses on developing methods to gain insights from large scientific data, typically originating from experiments and simulations. Here, large refers to data size, resolution, number of elements or fields, or combinations thereof. Meaningful analysis requires addressing challenges related both to presentation and to performance, and thus involves diverse—but closely interconnected—research directions. These include machine learning and optimization for visualization, high-performance computing (distributed and parallel approaches, in situ visualization), and multifield visualization. An overarching theme of my work is the automatic, data-driven configuration of visualization methods and systems.
2025
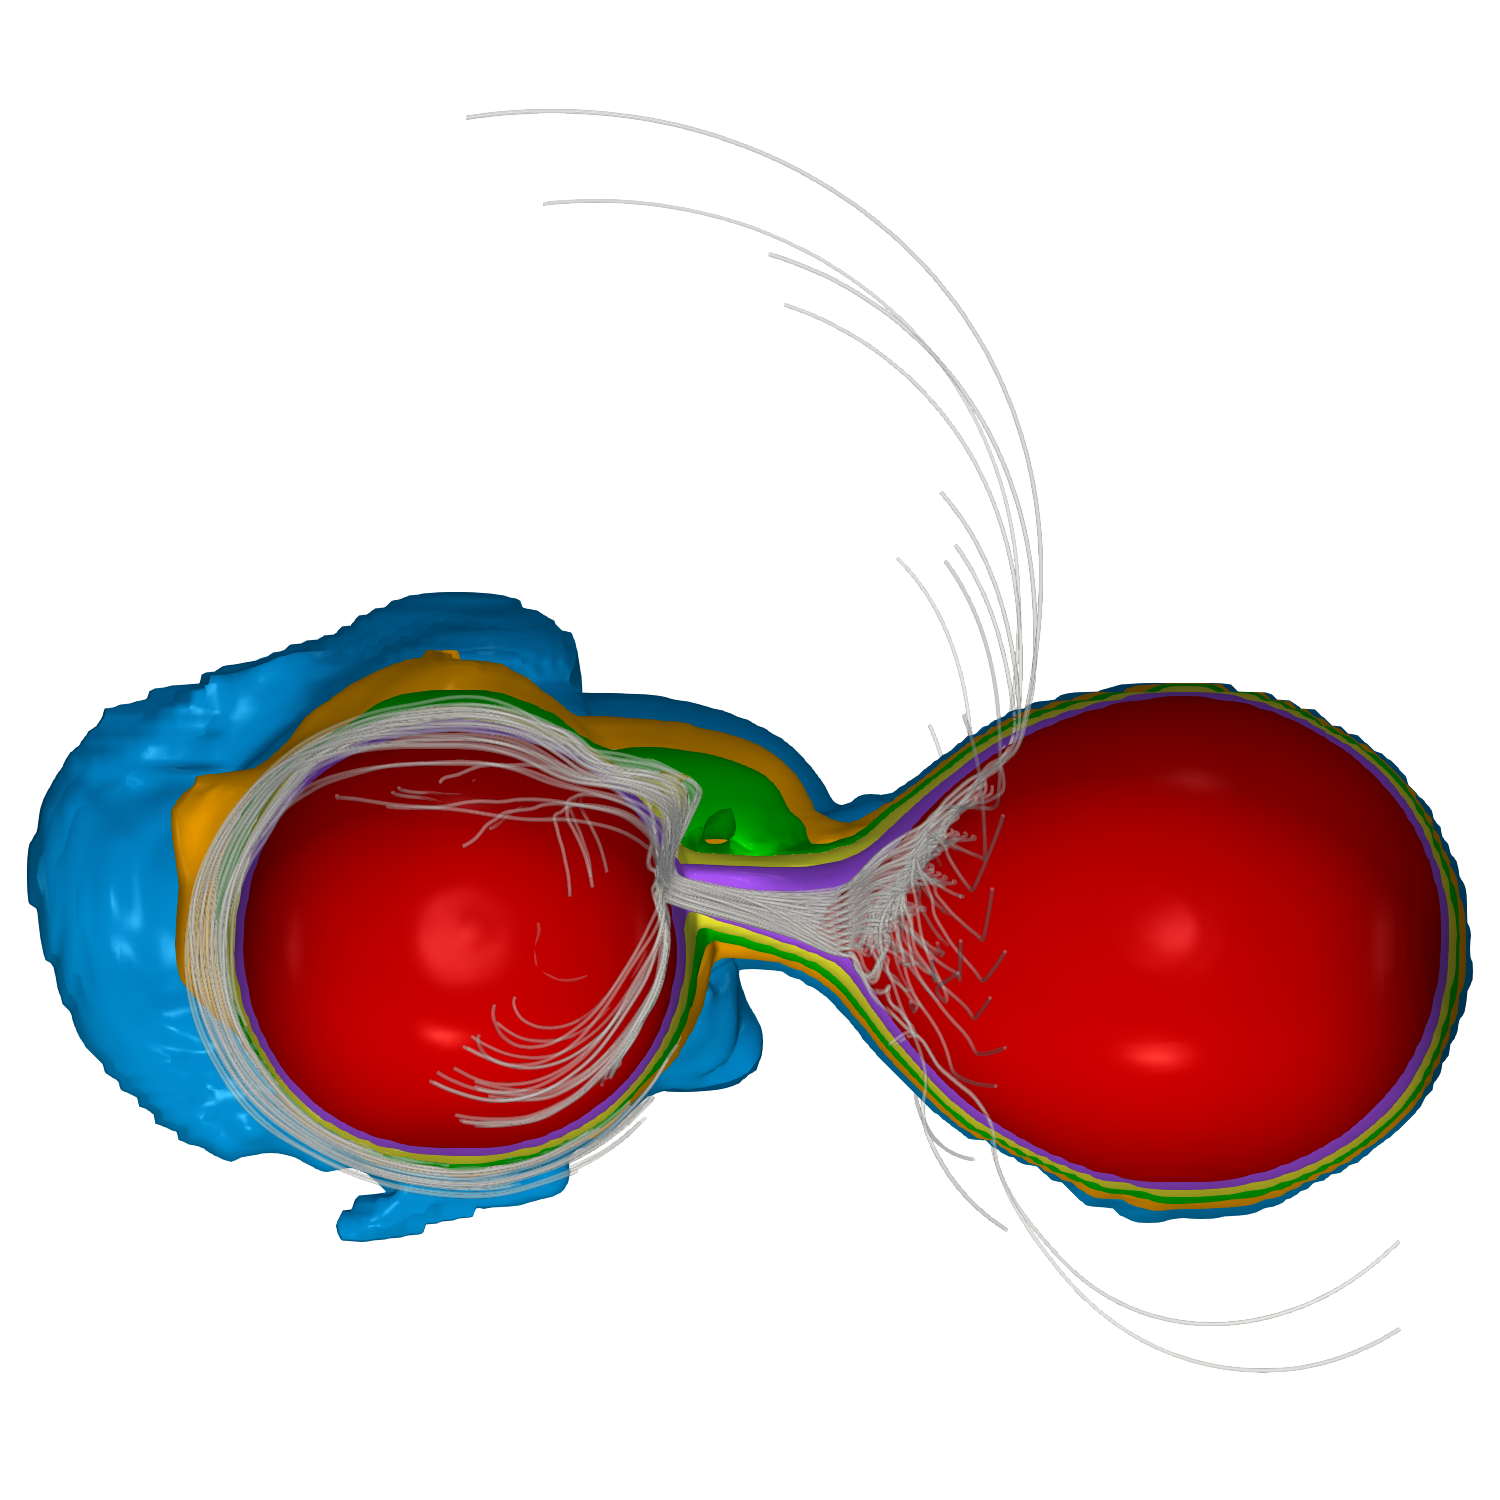
Visualizing the mass transfer flow in direct-impact accretion
J. Frank, A. Straub, S. Shiber, P. Amini, D. C. Marcello, P. Diehl, T. Ertl, F. Sadlo, S. Frey
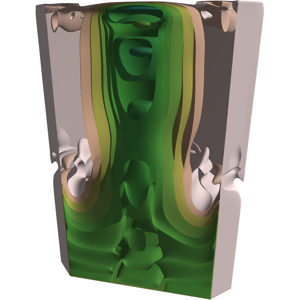
We use a variety of visualization techniques to display the interior and surface flows in a double white dwarf binary undergoing direct-impact mass transfer and evolving dynamically to a merger. The structure of the flow can be interpreted in terms of standard dynamical, cyclostrophic and geostrophic arguments. We describe and showcase some visualization and analysis techniques of potential interest for astrophysical hydrodynamics. In the context of R Coronae Borealis stars, we find that mixing of accretor material with donor material at the shear layer between the fast accretion belt and the slower rotating accretor body will always result in some dredge-up. We also discuss briefly some potential applications to other types of binaries.
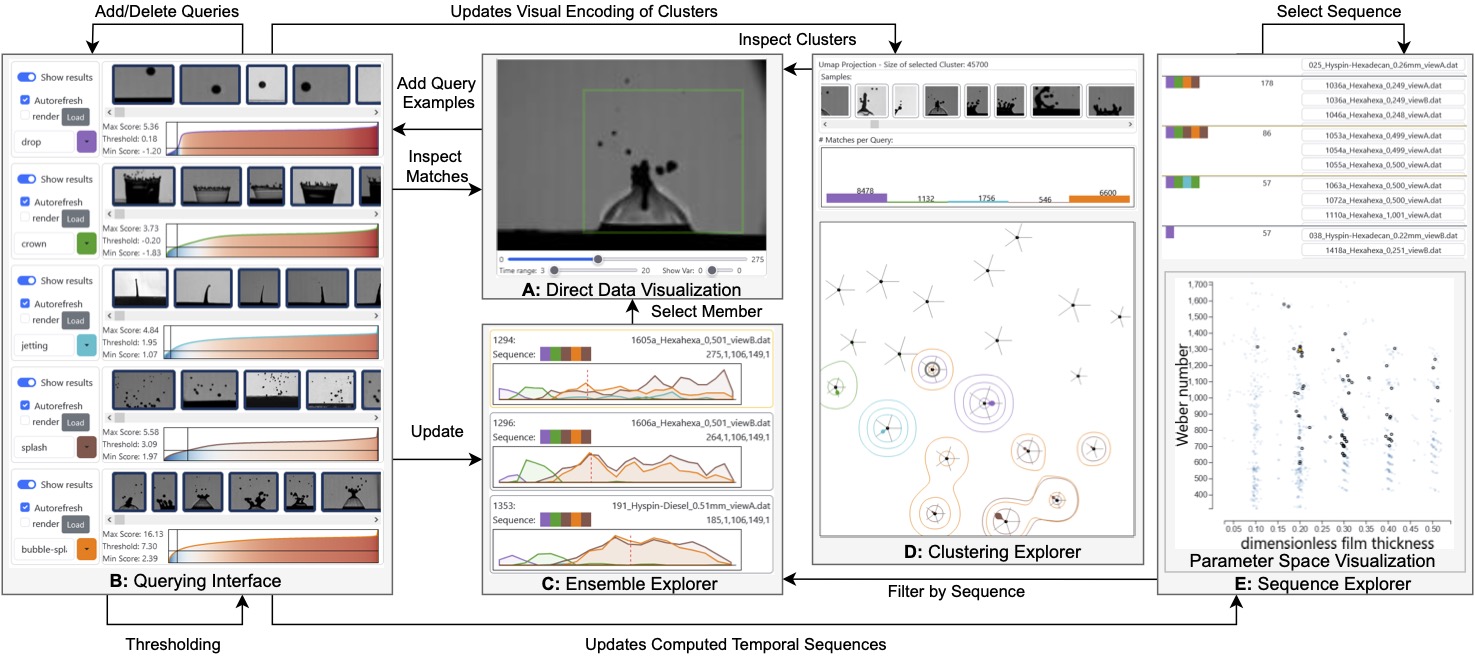
QVis: Query-based Visual Analysis of Multiscale Patterns in Spatiotemporal Ensembles
R. Bauer, Q. Ngo, G. Reina, S. Frey, M. Sedlmair
Understanding how dynamic patterns vary across large spatiotemporal ensembles is essential in many scientific domains. In fluid dynamics, for instance, researchers analyze how splash patterns in droplet impact experiments change with physical parameters such as fluid type or impact velocity. These experiments produce large volumes of data where patterns differ in size, shape, and duration, making manual analysis tedious and error-prone. Recently, interactive visualization approaches have been developed to assist analysis using learned similarity models for pattern-based querying. However, they assume fixed-size inputs and only support single-pattern queries, thus limiting their effectiveness for multiscale, multi-pattern analysis and exploration of ensembles. In this paper, we present a visual analysis approach for the interactive exploration of spatiotemporal ensembles through multiscale pattern querying. Our approach extends an existing similarity model to support variable-sized patterns, allowing users to define queries by selecting examples directly on visualized data. Coordinated views enable interactive querying, comparison, and analysis of pattern occurrences and relate pattern occurrences to ensemble parameters. A guidance mechanism supports the user in finding underexplored regions. We demonstrate the utility of our approach on synthetic and real-world datasets.
Domain expert feedback confirms that the approach is intuitive, easy to use, and effective for revealing parameter-pattern relationships.
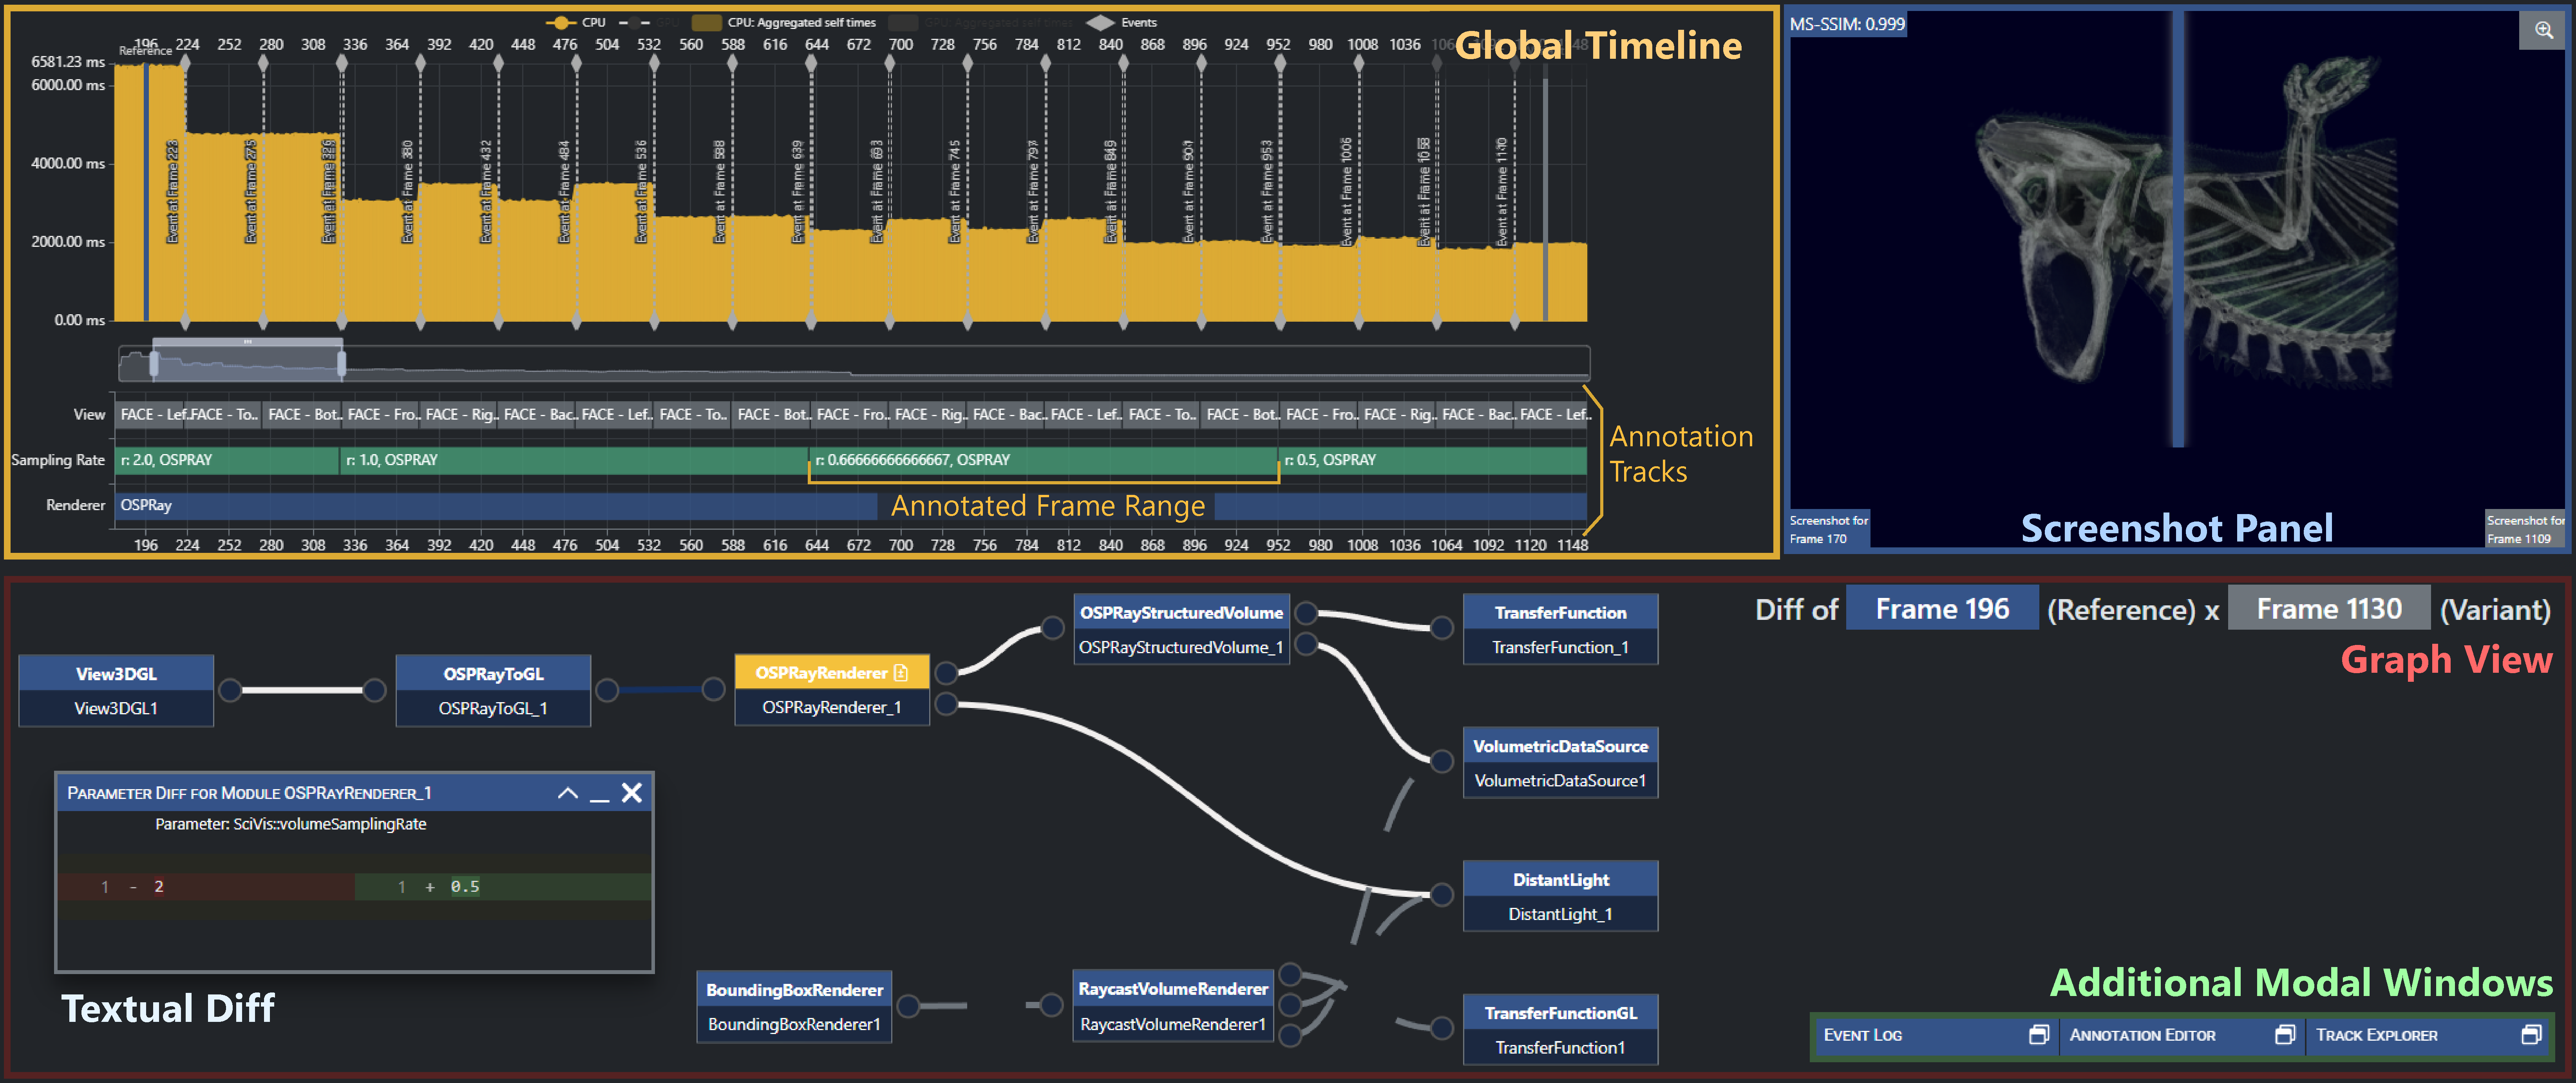
Visually Enriching and Comparing Runtime Performance of Visualization Pipelines Journal of Visualization
H. Tarner , P. Gralka, G. Reina, F. Beck, S. Frey
In many graphics and visualization frameworks, directed acyclic graphs are a
popular way to model visualization pipelines. Pipeline editors provide a visual
interface to modify the underlying graph and use, e.g., a node-link diagram to
visualize the data and program flow. This paper proposes an interactive tool
for post-mortem performance analysis and comparison of pipeline variants. We
extend the node-link representation of a visualization pipeline and enrich it
with fine-grained runtime performance metrics. Annotating this static structure
with dynamic performance information lets the developer evaluate performance
characteristics in depth. Our approach further supports a visual comparison of
two user-selected states of the graph. The comparison allows us to identify the
impact of (topological) changes on the graph’s performance. We demonstrate the
utility of our approach with different scientific visualization use cases and report
expert feedback.
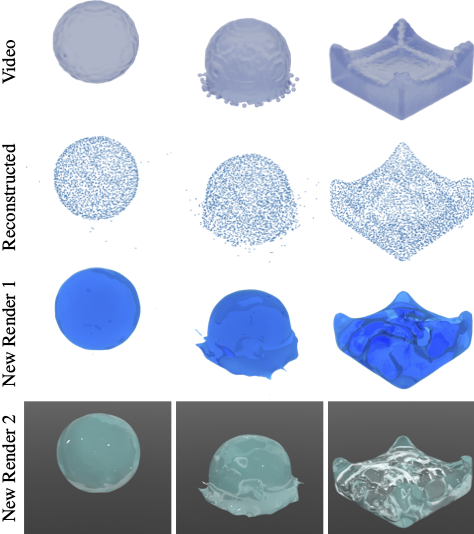
GaussFluids: Reconstructing Lagrangian Fluid Particles from Videos via Gaussian Splatting
F. Du, Y. Zhang, Y. Ji, X. Wang, C. Yao, J. Kosinka, S. Frey, A. Telea, X. Ban
Fluid simulation typically depends on manual modeling and visual assessment to achieve desired outcomes, which lacks objectivity and efficiency. To address this limitation, we propose GaussFluids, a novel approach for directly reconstructing temporally and spatially continuous Lagrangian fluid particles from videos. We employ a Lagrangian particle-based method instead of an Eulerian grid as it provides a direct spatial mass representation and is more suitable for capturing fine fluid details. First, to make discrete fluid particles differentiable over time and space, we extend Lagrangian particles with Gaussian probability densities, termed Gaussian Particles, constructing a differentiable fluid particle renderer that enables direct optimization of particle positions from visual data. Second, we introduce a fixed-length transform feature for each Gaussian Particle to encode pose changes over continuous time. Next, to preserve fundamental fluid physics—particularly incompressibility—we incorporate a density-based soft constraint to guide particle distribution within the fluid. Furthermore, we propose a hybrid loss function that focuses on maintaining visual, physical, and geometric consistency, along with an improved density optimization module to efficiently reconstruct spatiotemporally continuous fluids. We demonstrate the effectiveness of GaussFluids on multiple synthetic and real-world datasets, showing its capability to accurately reconstruct temporally and spatially continuous, physically plausible Lagrangian fluid particles from videos. Additionally, we introduce several downstream tasks, including novel view synthesis, style transfer, frame interpolation, fluid prediction, and fluid editing, which illustrate the practical value of GaussFluids.
AGri: Adaptive Thumbnails For Grid-based Visualizations
S. Frey
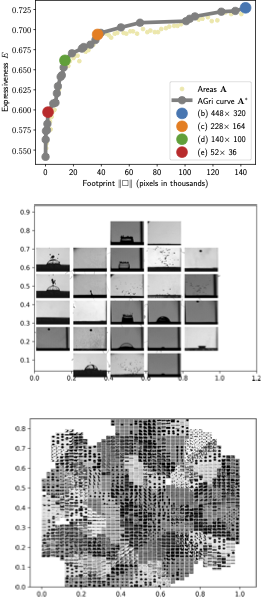
This work introduces AGri (Adaptive Thumbnails For Grid-based Visualizations), a method for dynamically adjusting thumbnails of spatiotemporal data—such as videos—to varying screen footprints in grid-based layouts. AGri aims to maximize thumbnail expressiveness, which quantifies how well similarity relationships among data members (e.g., video frames) are preserved. Thumbnails are generated via cropping, with crop windows optimized based on cumulative salience images. By modeling the trade-off between expressiveness and footprint size, AGri defines a curve—the AGri curve—representing Pareto-optimal visual representations. This curve enables dynamic selection of thumbnails suited to different grid sizes and resolutions. The approach is demonstrated on two datasets: a spatiotemporal ensemble from scientific experiments and an animated short film.

FLINT: Learning-based Flow Estimation and Temporal Interpolation for Scientific Ensemble Visualization
H. Gadirov, J. Roerdink, S. Frey
Scatterplots are widely used in exploratory data analysis. Representing data points as glyphs is often crucial for in-depth investigation, but this can lead to significant overlap and visual clutter. Recent post-processing techniques address this issue, but their computational and/or visual scalability is generally limited to thousands of points and unable to effectively deal with large datasets in the order of millions. This paper introduces Sca2Gri (Scalable Gridified Scatterplots), a grid-based post-processing
method designed for analysis scenarios where the number of data points substantially exceeds the number of glyphs that can be reasonably displayed. Sca2Gri enables interactive grid generation for large datasets, offering flexible user control of glyph size,
maximum displacement for point-to-cell mapping, and scatterplot focus area. While Sca2Gri’s computational complexity scales cubically with the number of cells (which is practically bound to thousands for legible glyph sizes), its complexity is linear with
respect to the number of data points, making it highly scalable beyond millions of points.

Sca2Gri: Scalable Gridified Scatterplots
S. Frey
Scatterplots are widely used in exploratory data analysis. Representing data points as glyphs is often crucial for in-depth investigation, but this can lead to significant overlap and visual clutter. Recent post-processing techniques address this issue, but their computational and/or visual scalability is generally limited to thousands of points and unable to effectively deal with large datasets in the order of millions. This paper introduces Sca2Gri (Scalable Gridified Scatterplots), a grid-based post-processing
method designed for analysis scenarios where the number of data points substantially exceeds the number of glyphs that can be reasonably displayed. Sca2Gri enables interactive grid generation for large datasets, offering flexible user control of glyph size,
maximum displacement for point-to-cell mapping, and scatterplot focus area. While Sca2Gri’s computational complexity scales cubically with the number of cells (which is practically bound to thousands for legible glyph sizes), its complexity is linear with
respect to the number of data points, making it highly scalable beyond millions of points.


HyperFLINT: Hypernetwork-based Flow Estimation and Temporal Interpolation for Scientific Ensemble Visualization
H. Gadirov, Q. Wu, D. Bauer, K.-L. Ma, J. Roerdink, S. Frey
We present HyperFLINT (Hypernetwork-based FLow estimation and temporal INTerpolation), a novel deep learning-based approach for estimating flow fields, temporally interpolating scalar fields, and facilitating parameter space exploration in spatio-temporal scientific ensemble data. This work addresses the critical need to explicitly incorporate ensemble parameters into the learning process, as traditional methods often neglect these, limiting their ability to adapt to diverse simulation settings and provide meaningful insights into the data dynamics. HyperFLINT introduces a hypernetwork to account for simulation parameters, enabling it to generate accurate interpolations and flow fields for each timestep by dynamically adapting to varying conditions, thereby outperforming existing parameter-agnostic approaches. The architecture features modular neural blocks with
convolutional and deconvolutional layers, supported by a hypernetwork that generates weights for the main network, allowing the model to better capture intricate simulation dynamics. A series of experiments demonstrates HyperFLINT’s significantly improved performance in flow field estimation and temporal interpolation, as well as its potential in enabling parameter space exploration, offering valuable insights into complex scientific ensembles.

Voronoi Cell Interface-Based Parameter Sensitivity Analysis for Labeled Samples
R. Bauer, M. Evers, Q. Ngo, G. Reina, S. Frey, M. Sedlmair
Varying the input parameters of simulations or experiments often leads to different classes of results. Parameter sensitivity analysis in this context includes estimating the sensitivity to the individual parameters, that is, to understand which parameters contribute most to changes in output classifications and for which parameter ranges these occur. We propose a novel visual parameter sensitivity analysis approach based on Voronoi cell interfaces between the sample points in the parameter space to tackle the problem. The Voronoi diagram of the sample points in the parameter space is first calculated.
We then extract Voronoi cell interfaces which we use to quantify the sensitivity to parameters, considering the class label information of each sample's corresponding output.
Multiple visual encodings are then utilized to represent the cell interface transitions and class label distribution, including stacked graphs for local parameter sensitivity.
We evaluate the approach’s expressiveness and usefulness with case studies for synthetic and real-world datasets.

VVRT: Virtual Volume Raycaster
L. v. d. Wal, P. Blesinger, J. Kosinka, S. Frey
Virtual Ray Tracer (VRT) is an educational tool to provide users with an interactive environment for understanding ray-tracing concepts.
Extending VRT, we propose Virtual Volume Raycaster (VVRT), an interactive application that allows to view and explore the volume raycasting process in real-time. The goal is to help users—students of scientific visualization and the general public—to better understand the steps of volume raycasting and their characteristics, for example the effect of early ray termination. VVRT shows a scene containing a camera casting rays which interact with a volume. Learners are able to modify and explore various settings, e.g., concerning the transfer function or ray sampling step size. Our educational tool is built with the cross-platform engine Unity, and we make it fully available to be extended and/or adjusted to fit the requirements of courses at other institutions, educational tutorials, or of enthusiasts from the general public. Two user studies demonstrate the effectiveness of VVRT in supporting the understanding and teaching of volume raycasting.

Peridynamics-Based Simulation of Viscoelastic Solids and Granular Materials
J. Wang, H. Wang, X. Wang, Y. Zhang, J. Kosinka, S. Frey, A. Telea, X. Ban
Viscoelastic solids and granular materials have been extensively studied in Classical Continuum Mechanics (CCM). However, CCM faces inherent limitations when dealing with discontinuity problems. Peridynamics, as a non-local continuum theory, provides a novel approach for simulating complex material behavior. We propose a unified viscoelastoplastic simulation framework based on State-Based Peridynamics (SBPD) which derives a time-dependent unified force density expression through the introduction of the Prony model. Within SBPD, we integrate various yield criteria and mapping strategies to support granular flow simulation, and dynamically adjust material stiffness according to local density. Additionally, we construct a multi-material coupling system incorporating viscoelastic materials, granular flows, and rigid bodies, enhancing computational stability while expanding the diversity of simulation scenarios. Experiments show that our method can effectively simulate relaxation, creep, and hysteresis behaviors of viscoelastic solids, as well as flow and
accumulation phenomena of granular materials, all of which are very challenging to simulate with earlier methods. Furthermore, our method allows flexible parameter adjustment to meet various simulation requirements.
2024
Visual simulation of bone cement blending and dynamic flow
S. Long, Y. Zhang, S. Frey, J. Kosinka, A. Telea, X. Wang, X. Ban
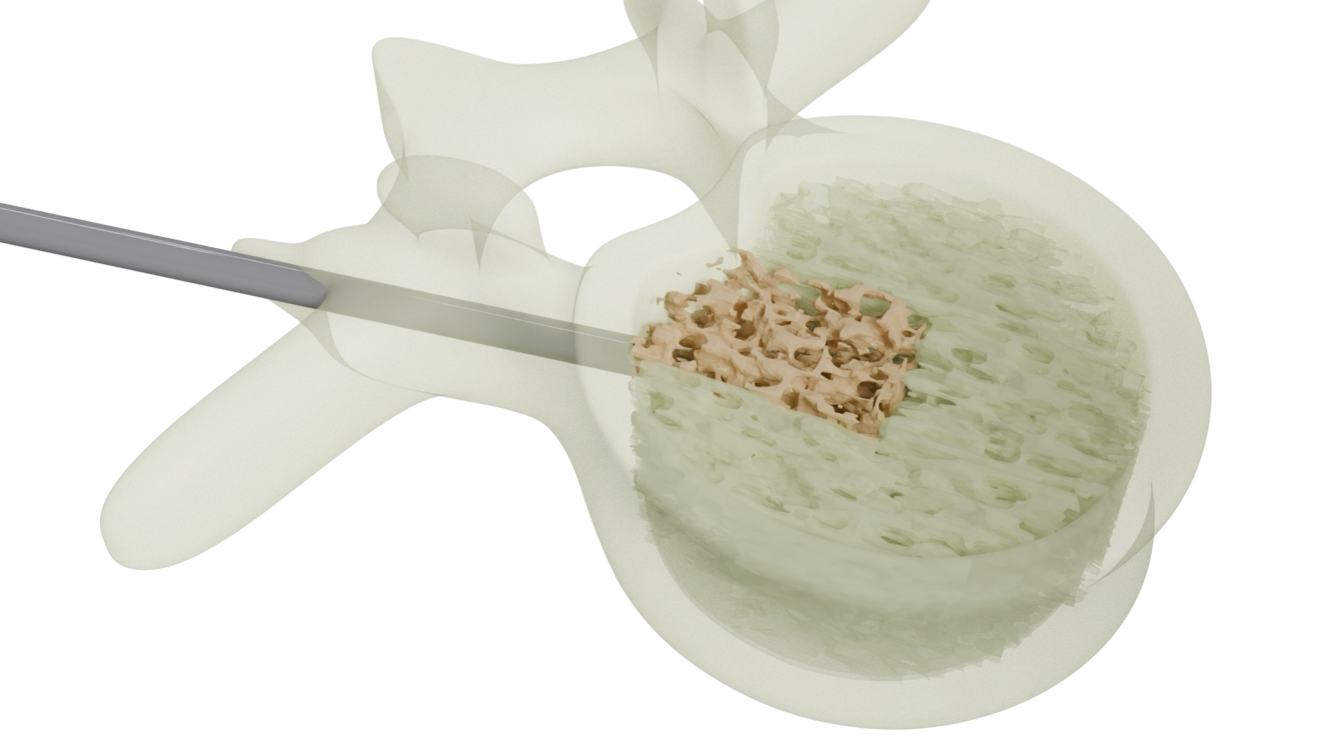
Bone cement filling is an important method for preventing osteoporosis and treating fractures. In bone cement filling surgery, the preparation and dosage of the cement usually depend on specific product manuals and the doctor’s experience. If bone cement is not used properly, it may cause additional damage. For teaching and auxiliary medical purposes, for example, assisting doctors to observe the possible flow of bone cement, this paper proposes a multiphase non-Newtonian fluid simulation method to simulate and visualize the flow behavior during the wet sand phase of bone cement blending and polymerization. Our method enables showing intuitively the application process of bone cement under different scene settings to obtain dynamic bone cement effects with high stability and performance. Compared with other methods, our method can simulate highly viscous mixed fluids efficiently and robustly, which supports our method’s usage in the aforementioned training and experimentation scenarios.
Multiphase Viscoelastic Non-Newtonian Fluid Simulation
Y. Zhang, S. Long, Y. Xu, X. Wang, C. Yao, J. Kosinka, S. Frey, A. Telea, X. Ban
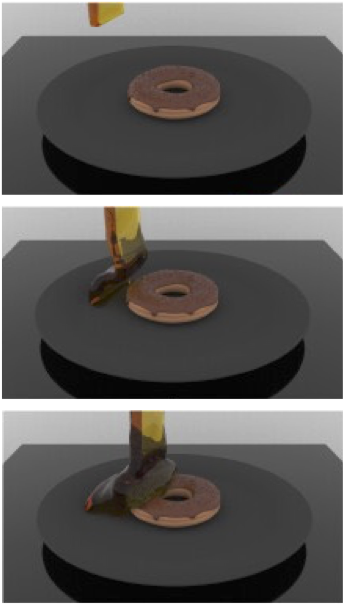
We propose an SPH-based method for simulating viscoelastic non-Newtonian fluids within a multiphase framework. For this, we use mixture models to handle component transport and conformation tensor methods to handle the fluid's viscoelastic stresses. In addition, we consider a bonding effects network to handle the impact of microscopic chemical bonds on phase transport. Our method supports the simulation of both steady-state viscoelastic fluids and discontinuous shear behavior. Compared to previous work on single-phase viscous non-Newtonian fluids, our method can capture more complex behavior, including material mixing processes that generate non-Newtonian fluids. We adopt a uniform set of variables to describe shear thinning, shear thickening, and ordinary Newtonian fluids while automatically calculating local rheology in inhomogeneous solutions. In addition, our method can simulate large viscosity ranges under explicit integration schemes, which typically requires implicit viscosity solvers under earlier single-phase frameworks.
FLINT: Learning-based Flow Estimation and Temporal Interpolation for Scientific Ensemble Visualization
H. Gadirov, J. Roerdink, S. Frey
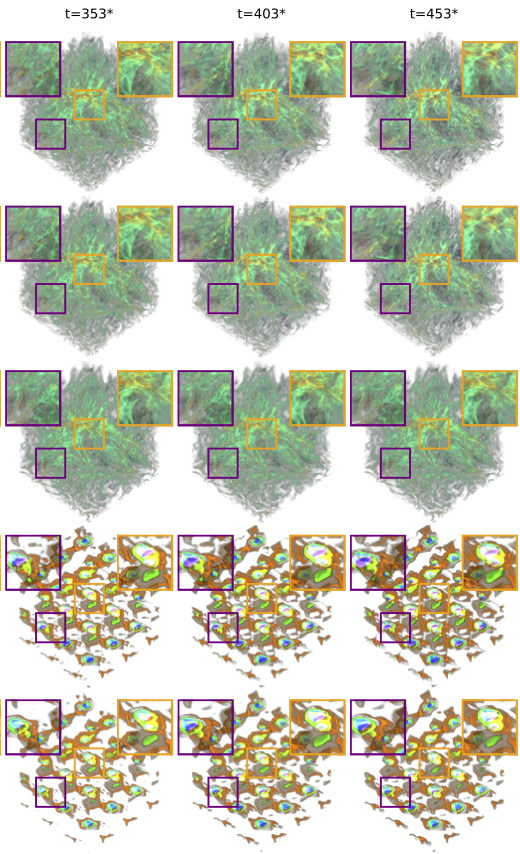
We present FLINT (learning-based FLow estimation and temporal INTerpolation), a novel deep learning-based approach to estimate flow fields for 2D+time and 3D+time scientific ensemble data. FLINT can flexibly handle different types of scenarios with (1) a flow field being partially available for some members (e.g., omitted due to space constraints) or (2) no flow field being available at all (e.g., because it could not be acquired during an experiment). The design of our architecture allows to flexibly cater to both cases simply by adapting our modular loss functions, effectively treating the different scenarios as flow-supervised and flow-unsupervised problems, respectively (with respect to the presence or absence of ground-truth flow). To the best of our knowledge, FLINT is the first approach to perform flow estimation from scientific ensembles, generating a corresponding flow field for each discrete timestep, even in the absence of original flow information. Additionally, FLINT produces high-quality temporal interpolants between scalar fields. FLINT employs several neural blocks, each featuring several convolutional and deconvolutional layers. We demonstrate performance and accuracy for different usage scenarios with scientific ensembles from both simulations and experiments.
2023

Visual Analysis of Displacement Processes in Porous Media using Spatio-Temporal Flow Graphs
A. Straub, N. Karadimitriou, G. Reina, S. Frey, H. Steeb, T. Ertl
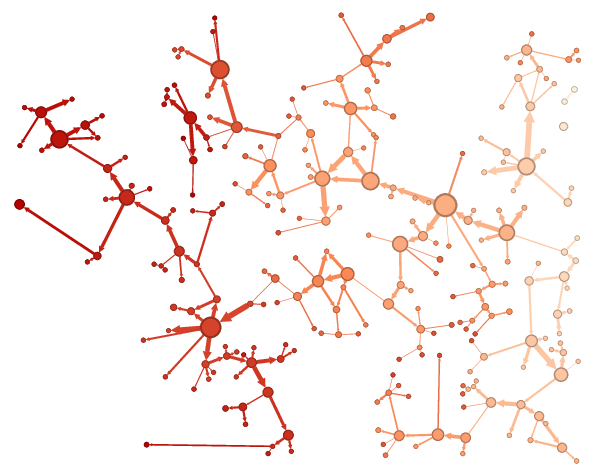
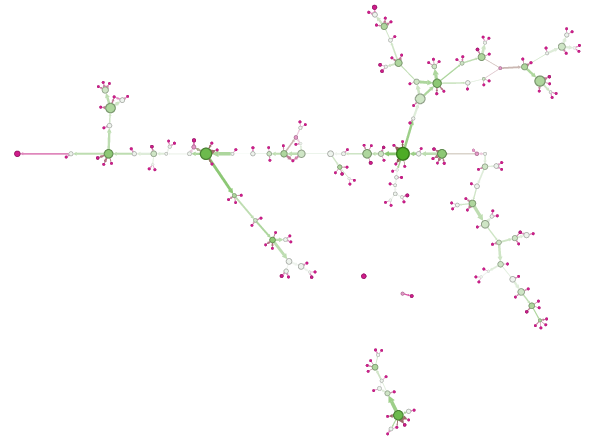
We developed a new approach comprised of different visualizations for the comparative spatio-temporal analysis of displacement processes in porous media. We aim to analyze and compare ensemble datasets from experiments to gain insight into the influence of different parameters on fluid flow. To capture the displacement of a defending fluid by an invading fluid, we first condense an input image series to a single time map. From this map, we generate a spatio-temporal flow graph covering the whole process. This graph is further simplified to only reflect topological changes in the movement of the invading fluid. Our interactive tools allow the visual analysis of these processes by visualizing the graph structure and the context of the experimental setup, as well as by providing charts for multiple metrics. We apply our approach to analyze and compare ensemble datasets jointly with domain experts, where we vary either fluid properties or the solid structure of the porous medium. We finally report the generated insights from the domain experts and discuss our contribution's advantages, generality, and limitations.
Visual Ensemble Analysis of Fluid Flow in Porous Media Across Simulation Codes and Experiment
R. Bauer, Q. Ngo, G. Reina, S. Frey, B. Flemisch, H. Hauser, T. Ertl, M. Sedlmair
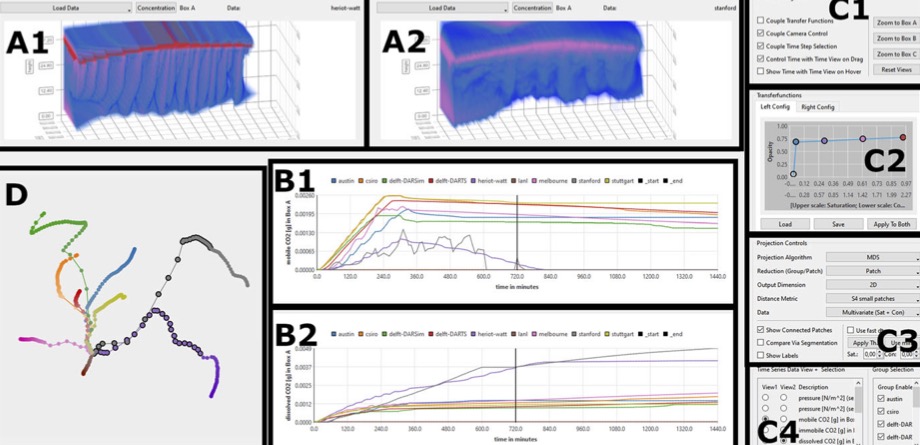
We study the question of how visual analysis can support the comparison of spatio-temporal ensemble data of liquid and gas flow in porous media. To this end, we focus on a case study, in which nine different research groups concurrently simulated the process of injecting CO2 into the subsurface. We explore different data aggregation and interactive visualization approaches to compare and analyze these nine simulations. In terms of data aggregation, one key component is the choice of similarity metrics that define the relationship between different simulations. We test different metrics and find that using the machine-learning model “S4” (tailored to the present study) as metric provides the best visualization results. Based on that, we propose different visualization methods. For overviewing the data, we use dimensionality reduction methods that allow us to plot and compare the different simulations in a scatterplot. To show details about the spatio-temporal data of each individual simulation, we employ a space-time cube volume rendering. All views support linking and brushing interaction to allow users to select and highlight subsets of the data simultaneously across multiple views. We use the resulting interactive, multi-view visual analysis tool to explore the nine simulations and also to compare them to data from experimental setups. Our main findings include new insights into ranking of simulation results with respect to experimental data, and the development of gravity fingers in simulations.
Parallel Compositing of Volumetric Depth Images for Interactive Visualization of Distributed Volumes at High Frame Rates
A. Gupta, P. Incardona, A. Brock, G. Reina, S. Frey, S. Gumhold, U. Günther, I. Sbalzarini
EGPGV 2023 | best paper
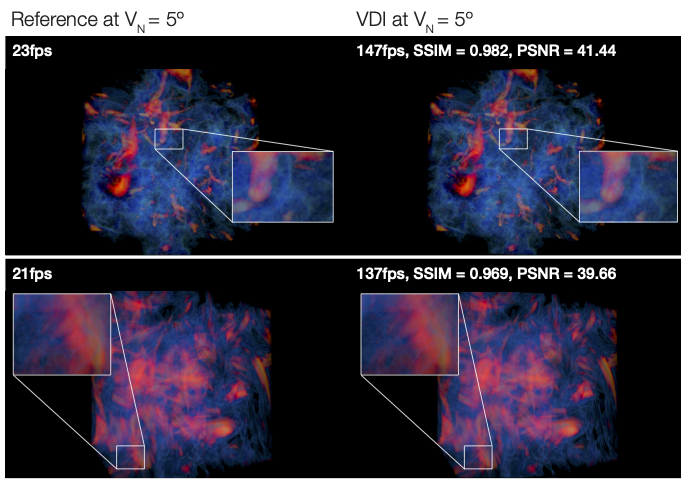
We present a parallel compositing algorithm for Volumetric Depth Images (VDIs) of large three-dimensional volume data. Large distributed volume data are routinely produced in both numerical simulations and experiments, yet it remains challenging to visualize them at smooth, interactive frame rates. VDIs are view-dependent piecewise constant representations of volume data that offer a potential solution. They are more compact and less expensive to render than the original data. So far, however, there is no method for generating VDIs from distributed data. We propose an algorithm that enables this by sort-last parallel generation and compositing of VDIs with automatically chosen content-adaptive parameters. The resulting composited VDI can then be streamed for remote display, providing responsive visualization of large, distributed volume data.
Curvature-enhanced Neural Subdivision
S. Bruin, S. Frey, J. Kosinka
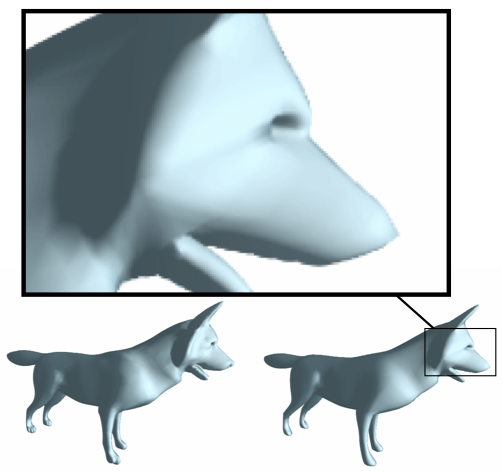
Subdivision is an important and widely used technique for obtaining dense meshes from coarse control (triangular) meshes for modelling and animation purposes. Most subdivision algorithms use engineered features (subdivision rules). Recently, neural subdivision successfully applied machine learning to the subdivision of a triangular mesh. It uses a simple neural network to learn an optimal vertex positioning during a subdivision step. We propose an extension to the neural subdivision algorithm that introduces explicit curvature information into the network. This makes a larger amount of relevant information accessible which allows the network to yield better results. We demonstrate that this modification yields significant improvement over the original algorithm, in terms of both Hausdorff distance and mean squared error.
Efficient Raycasting of Volumetric Depth Images for Remote Visualization of Large Volumes at High Frame Rates
A. Gupta, U. Günther, P. Incardona, G. Reina, S. Frey, S. Gumhold, I. Sbalzarini
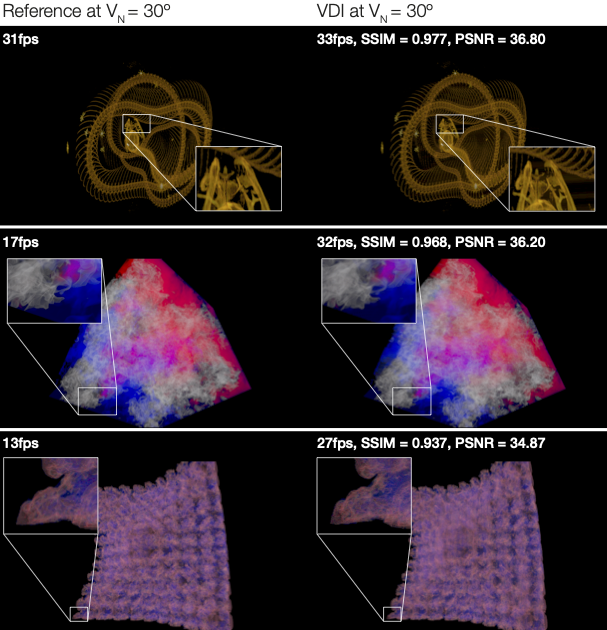
We present an efficient raycasting algorithm for rendering Volumetric Depth Images (VDIs), and we show how it can be used in a remote visualization setting with VDIs generated and streamed from a remote server. VDIs are compact view-dependent volume representations that enable interactive visualization of large volumes at high frame rates by decoupling viewpoint changes from expensive rendering calculations. However, current rendering approaches for VDIs struggle with achieving interactive frame rates at high image resolutions. Here, we exploit the properties of perspective projection to simplify intersections of rays with the view-dependent frustums in a VDI and leverage spatial smoothness in the volume data to minimize memory accesses. Benchmarks show that responsive frame rates can be achieved close to the viewpoint of generation for HD display resolutions, providing high-fidelity approximate renderings of Gigabyte-sized volumes. We also propose a method to subsample the VDI for preview rendering, maintaining high frame rates even for large viewpoint deviations. We provide our implementation as an extension of an established open-source visualization library.
Virtual Ray Tracer 2.0
C. van Wezel, W. Verschoore de la Houssaije, S. Frey, J. Kosinka
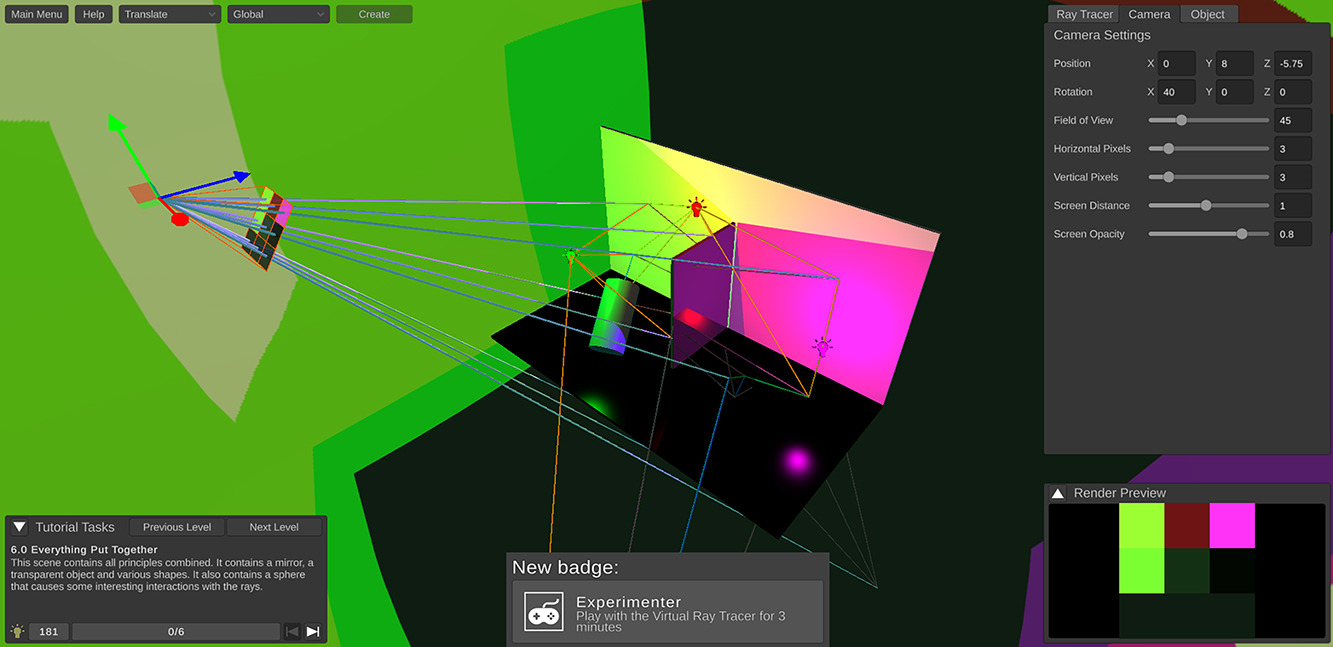
Building on our original Virtual Ray Tracer tool, we present Virtual Ray Tracer 2.0, an interactive and gamified application that allows students/users to view and explore the ray tracing process in real-time. The application shows a scene containing a camera casting rays which interact with objects in the scene. Users are able to modify and explore ray properties such as their animation speed, the number of rays and their visual style, as well as the material properties of the objects in the scene.
The goal of the application is to help the users – students of Computer Graphics and the general public – to better understand the ray tracing process and its characteristics. This includes not only the basics of ray tracing, but also more advanced concepts such as soft shadows. To invite users to learn and explore, various explanations and scenes are provided by the application at different levels of complexity, each with a step-by-step tutorial. Several user studies showed the effectiveness of the tool in supporting the understanding and teaching of ray tracing. The educational tool is built with the cross-platform engine Unity, and we make it fully available to be extended and/or adjusted to fit the requirements of courses at other institutions, educational tutorials, or of enthusiasts from the general public.
2022
Optimizing Grid Layouts for Level-of-Detail Exploration of Large Data Collections
S. Frey
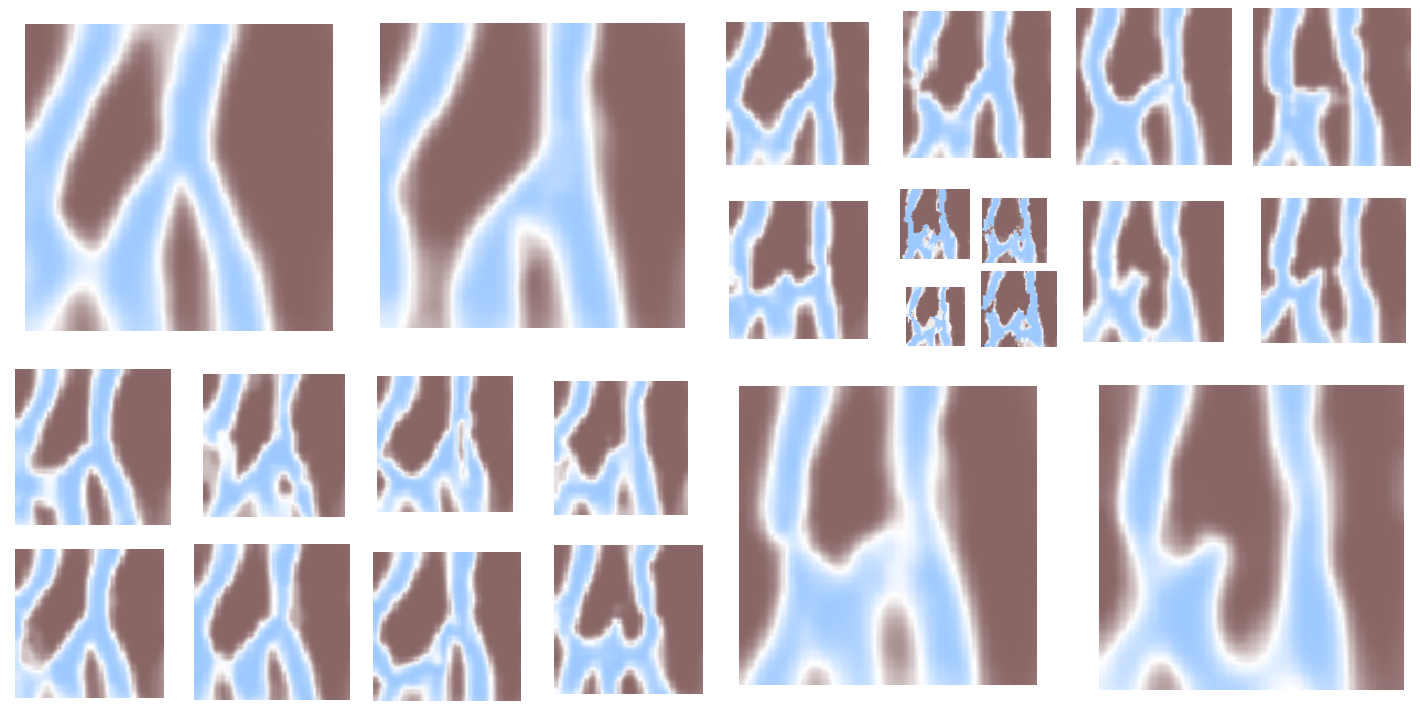
This paper introduces an optimization approach for generating grid layouts from large data collections such that they are amenable to level-of-detail presentation and exploration. Classic (flat) grid layouts visually do not scale to large collections, yielding overwhelming numbers of tiny member representations. The proposed local search-based progressive optimization scheme generates hierarchical grids: leaves correspond to one grid cell and represent one member, while inner nodes cover a quadratic range of cells and convey an aggregate of contained members. The scheme is solely based on pairwise distances and jointly optimizes for homogeneity within inner nodes and across grid neighbors. The generated grids allow to present and flexibly explore the whole data collection with arbitrary local granularity. Diverse use cases featuring large data collections exemplify the application: stock market predictions from a Black-Scholes model, channel structures in soil from Markov chain Monte Carlo, and image collections with feature vectors from neural network classification models. The paper presents feedback by a domain scientist, compares against previous approaches, and demonstrates visual and computational scalability to a million members, surpassing classic grid layout techniques by orders of magnitude.
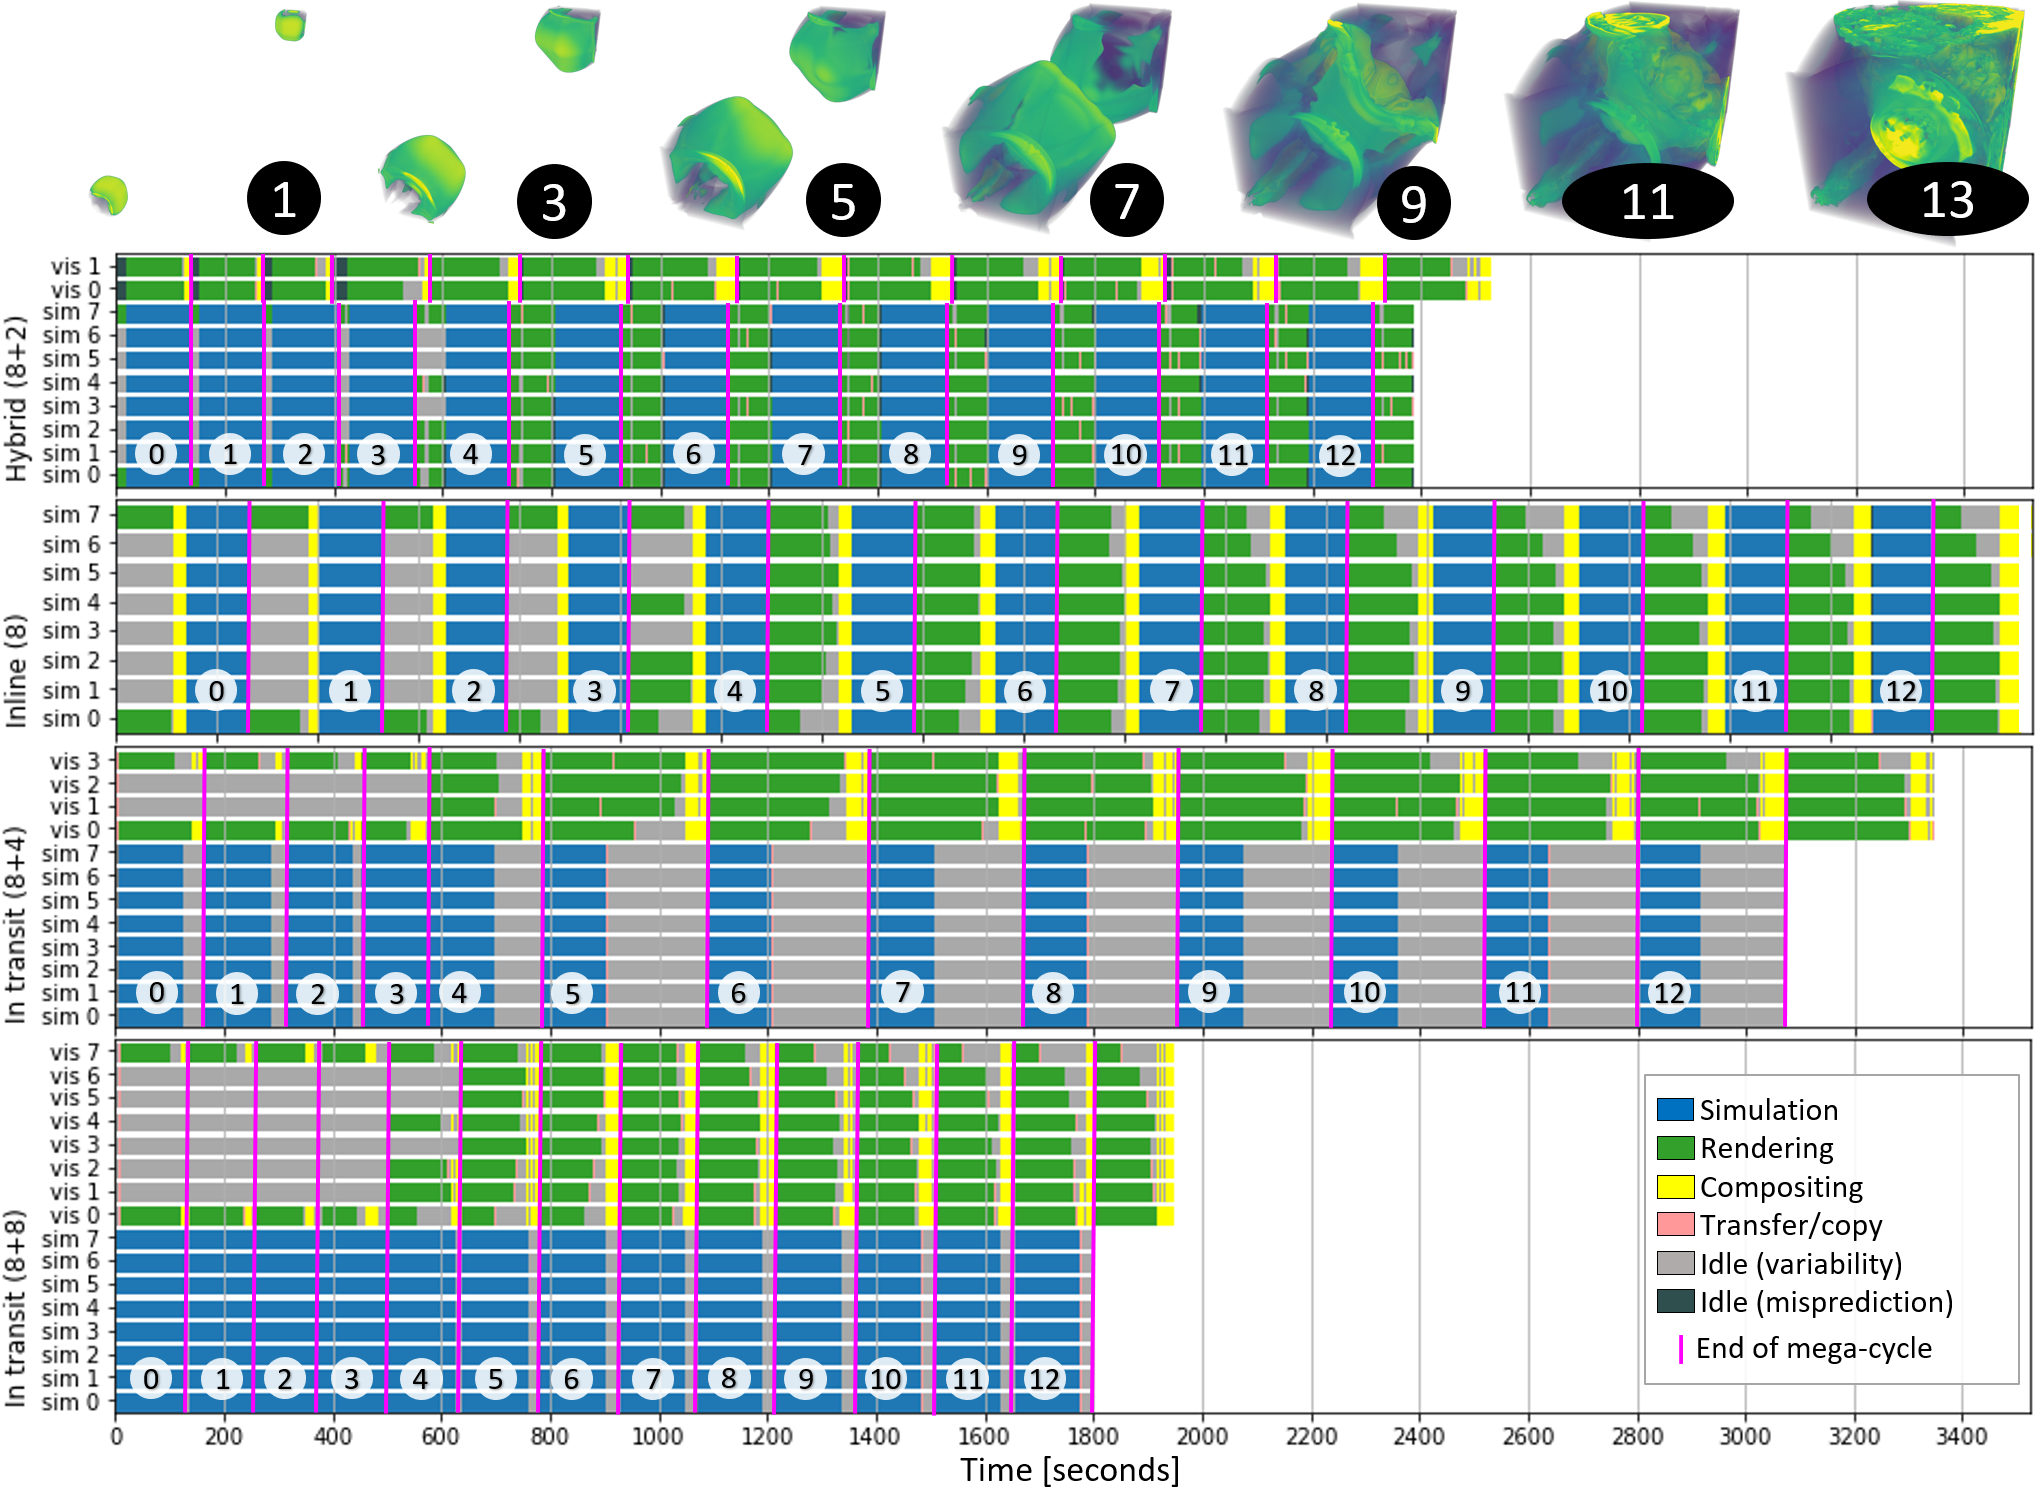
A Hybrid In Situ Approach for
Cost Efficient Image Database Generation
V. Bruder, M. Larsen, T. Ertl, H. Childs, S. Frey
The visualization of results while the simulation is running is increasingly common in extreme scale computing environments. We present a novel approach for in situ generation of image databases to achieve cost savings on supercomputers. Our approach, a hybrid between traditional inline and in transit techniques, dynamically distributes visualization tasks between simulation nodes and visualization nodes, using probing as a basis to estimate rendering cost. Our hybrid design differs from previous works in that it creates opportunities to minimize idle time from four fundamental types of inefficiency: variability, limited scalability, overhead, and rightsizing. We demonstrate our results by comparing our method against both inline and in transit methods for a variety of configurations, including two simulation codes and a scaling study that goes above 19K cores. Our findings show that our approach is superior in many configurations. As in situ visualization becomes increasingly ubiquitous, we believe our technique could lead to significant amounts of reclaimed cycles on supercomputers.
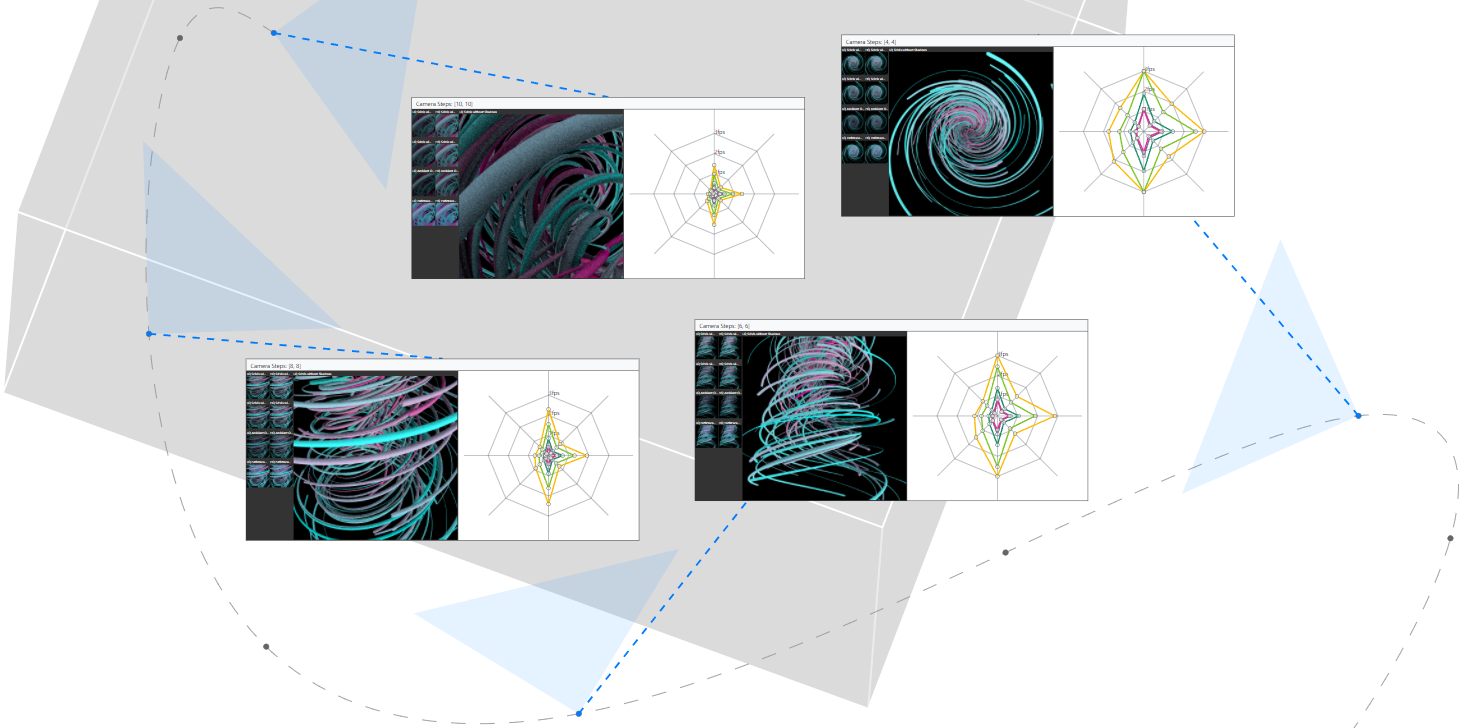
Visually Comparing Rendering Performance from Multiple Perspectives
H. Tarner, V. Bruder, S. Frey, T. Ertl, and F. Beck
Evaluation of rendering performance is crucial when selecting or developing algorithms, but challenging as performance can largely differ across a set of selected scenarios. Despite this, performance metrics are often reported and compared in a highly aggregated way. In this paper we suggest a more fine-grained approach for the evaluation of rendering performance, taking into account multiple perspectives on the scenario: camera position and orientation along different paths, rendering algorithms, image resolution, and hardware. The approach comprises a visual analysis system that shows and contrasts the data from these perspectives. The users can explore combinations of perspectives and gain insight into the performance characteristics of several rendering algorithms. A stylized representation of the camera path provides a base layout for arranging the multivariate
performance data as radar charts, each comparing the same set of rendering algorithms while linking the performance data
with the rendered images. To showcase our approach, we analyze two types of scientific visualization benchmarks.
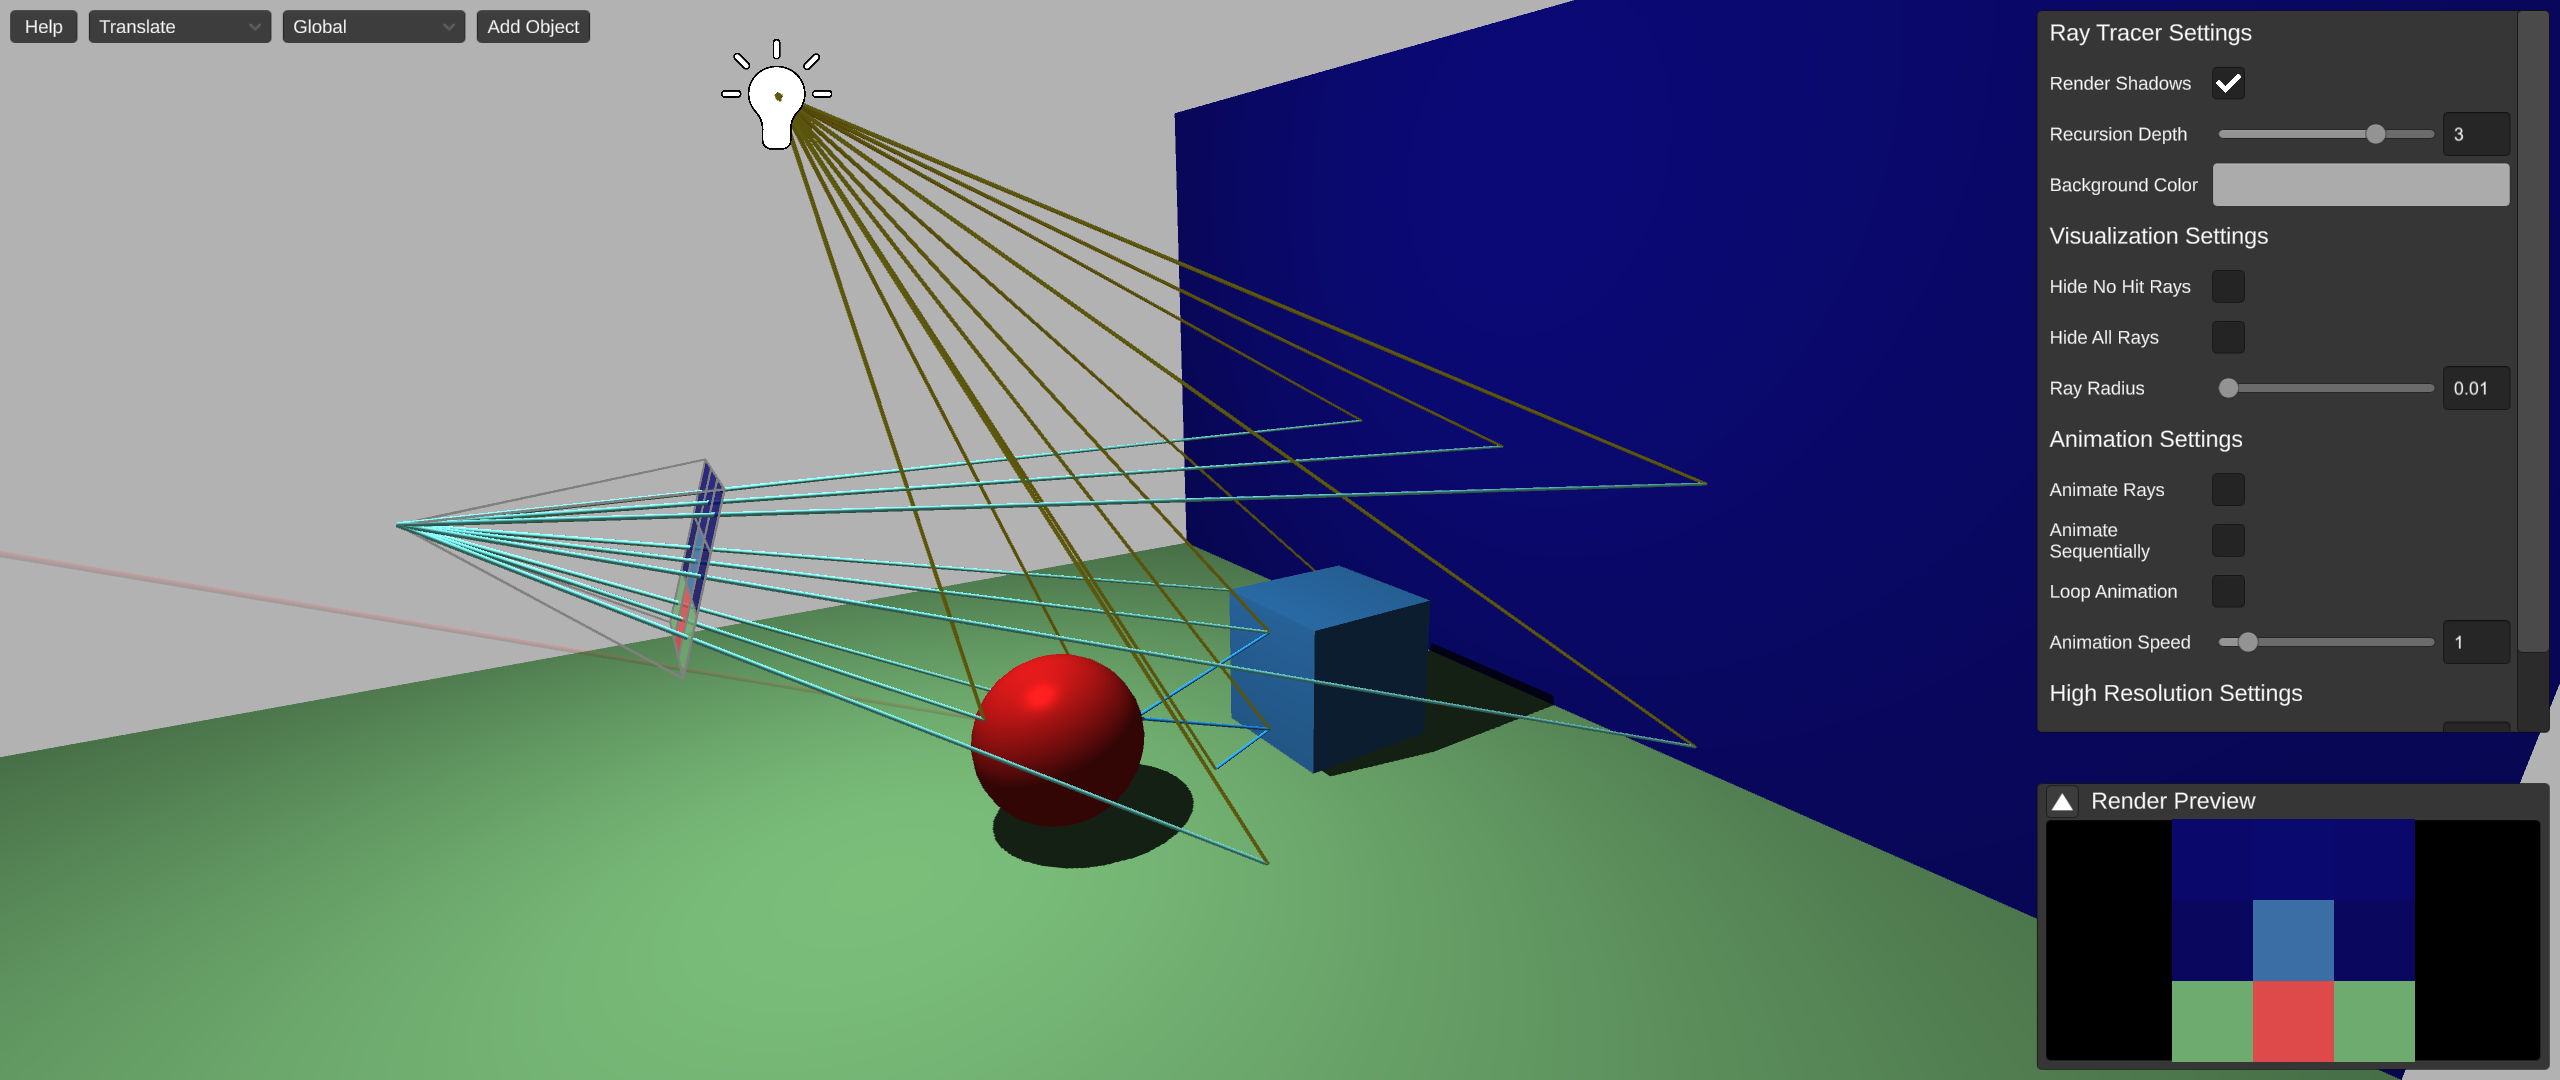
Virtual Ray Tracer
W. A. Verschoore de la Houssaije, C.S. van Wezel, S. Frey, J. Kosinka
Ray tracing is one of the more complicated techniques commonly taught in (introductory) Computer Graphics courses. Vi- sualizations can help with understanding complex ray paths and interactions, but currently there are no openly accessible applications that focus on education. We present Virtual Ray Tracer, an interactive application that allows students/users to view and explore the ray tracing process in real-time. The application shows a scene containing a camera casting rays which interact with objects in the scene. Users are able to modify and explore ray properties such as their animation speed, the number of rays as well as the material properties of the objects in the scene. The goal of the application is to help the users—students of Computer Graphics and the general public—to better understand the ray tracing process and its characteristics. To invite users to learn and explore, various explanations and scenes are provided by the application at different levels of complexity. A user study showed the effectiveness of Virtual Ray Tracer in supporting the understanding and teaching of ray tracing. Our educational tool is built with the cross-platform engine Unity, and we make it fully available to be extended and/or adjusted to fit the requirements of courses at other institutions or of educational tutorials.
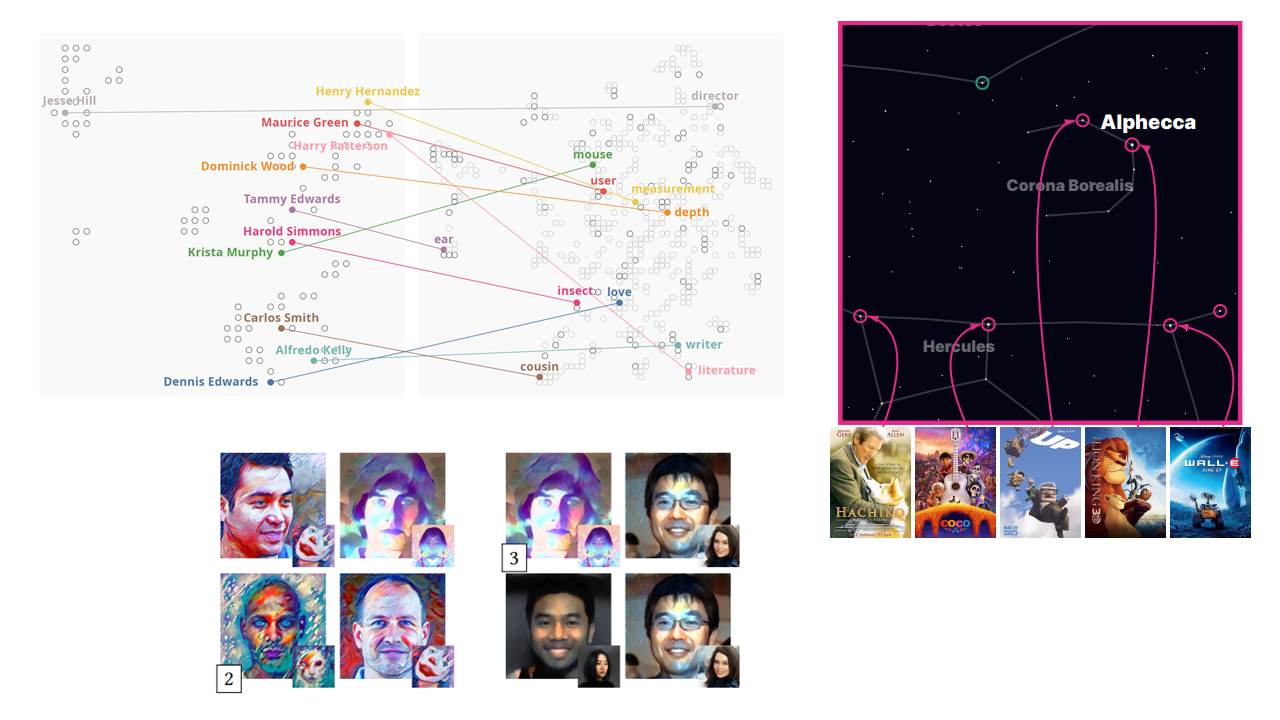
Metaphorical Visualization: Mapping Data to Familiar Concepts
G. Tkachev, R. Cutura, M. Sedlmair, S. Frey, T. Ertl
We present a new approach to visualizing data that is well-suited for personal and casual applications. The idea is to map the data to another dataset that is already familiar to the user, and then rely on their existing knowledge to illustrate relationships in the data. We construct the map by preserving pairwise distances or by maintaining relative values of specific data attributes. This metaphorical mapping is very flexible and allows us to adapt the visualization to its application and target audience. We present several examples where we map data to different domains and representations. This includes mapping data to cat images, encoding research interests with neural style transfer and representing movies as stars in the night sky. Overall, we find that although metaphors are not as accurate as the traditional techniques, they can help design engaging and personalized visualizations.
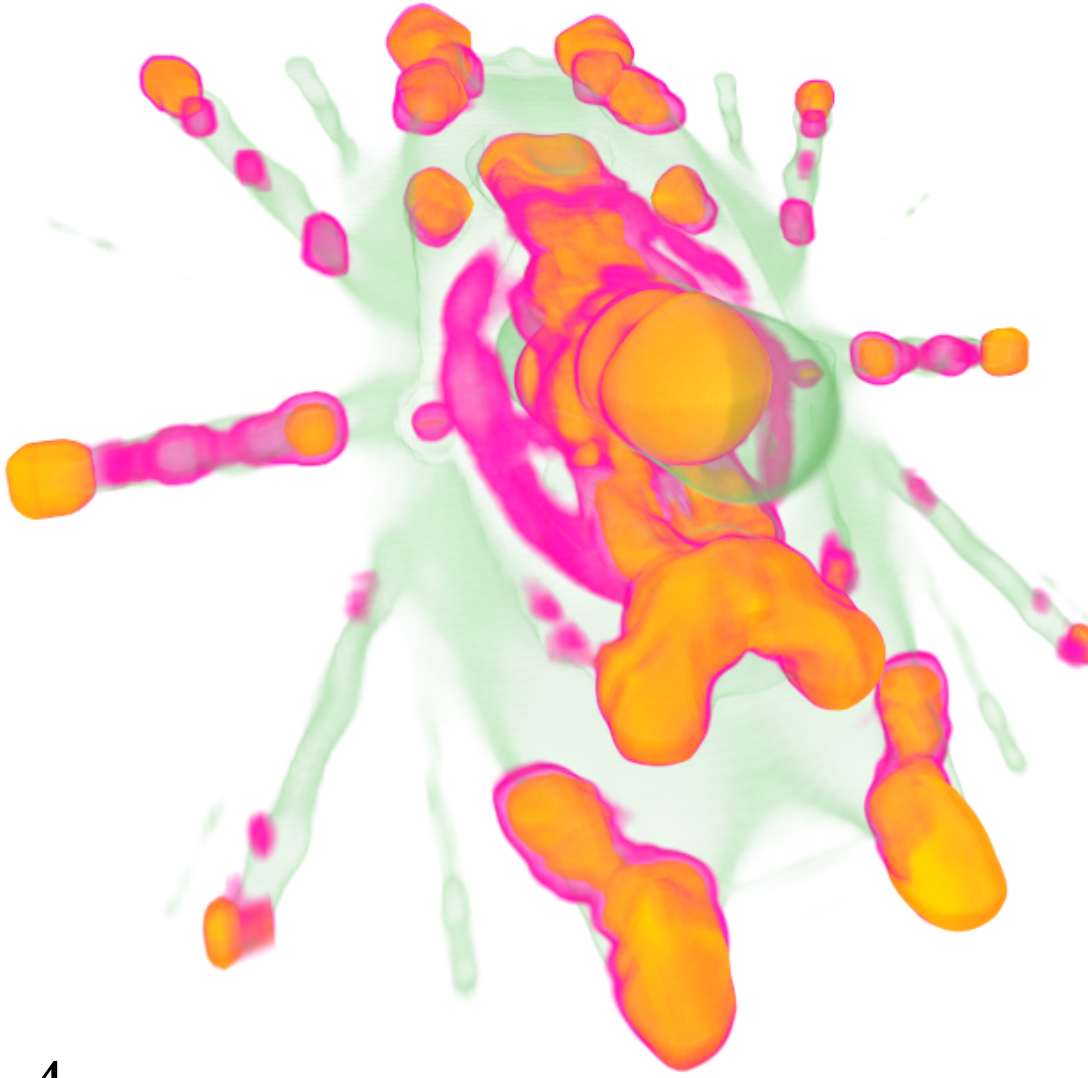
Anticipation of User Performance For Adapting Visualization Systems
S. Frey (organizers: J. Borst, A. Bulling, C. Gonzalez, and N. Russwinkel)
Even after three decades of research on human-machine interaction (HMI), current systems still lack the ability to predict mental states of their users, i.e., they fail to understand users’ intentions, goals, and needs and therefore cannot anticipate their actions. This lack of anticipation drastically restricts their capabilities to interact and collaborate effectively with humans. The goal of this Dagstuhl Seminar was to discuss the scientific foundations of a new generation of human-machine systems that anticipate, and proactively adapt to, human actions by monitoring their attention, behavior, and predicting their mental states. Anticipation might be realized by using mental models of tasks, specific situations and systems to build up expectations about intentions, goals, and mental states that gathered evidence can be tested against. The anticipation of user performance for a given (configuration of) visualization system would allow to explicitly optimize the visual representation and interface for a user to gain insights more quickly and/or more accurately.
2021
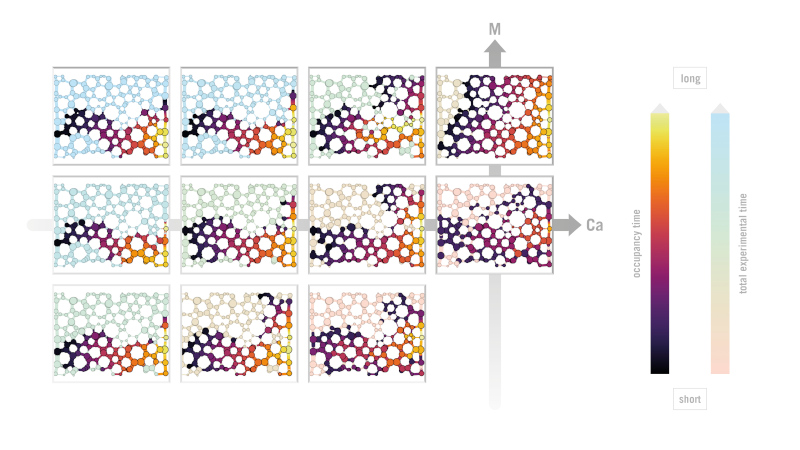
Visual Analysis of Two-Phase Flow Displacement Processes in Porous Media
S. Frey, S. Scheller, N. Karadimitriou, D. Lee, G. Reina, H. Steeb, T. Ertl
We developed a new visualization approach to gain a better understanding of the displacement of one fluid phase by another in porous media. This is based on a recent experimental parameter study with varying capillary numbers and viscosity ratios.
We analyze the temporal evolution of characteristic values in this two-phase flow scenario and discuss how to directly compare experiments across different temporal scales.
To enable spatio-temporal analysis, we introduce a new abstract visual representation showing which paths through the porous medium were occupied and for how long. These transport networks allow to assess the impact of different acting forces and they are designed to yield expressive comparability and linking to the experimental parameter space both supported by additional visual cues.
This joint work of porous media experts and visualization researchers yields new insights regarding two-phase flow on the microscale, and our visualization approach contributes towards the overarching goal of the domain scientists to characterize porous media flow based on capillary numbers and viscosity ratios.
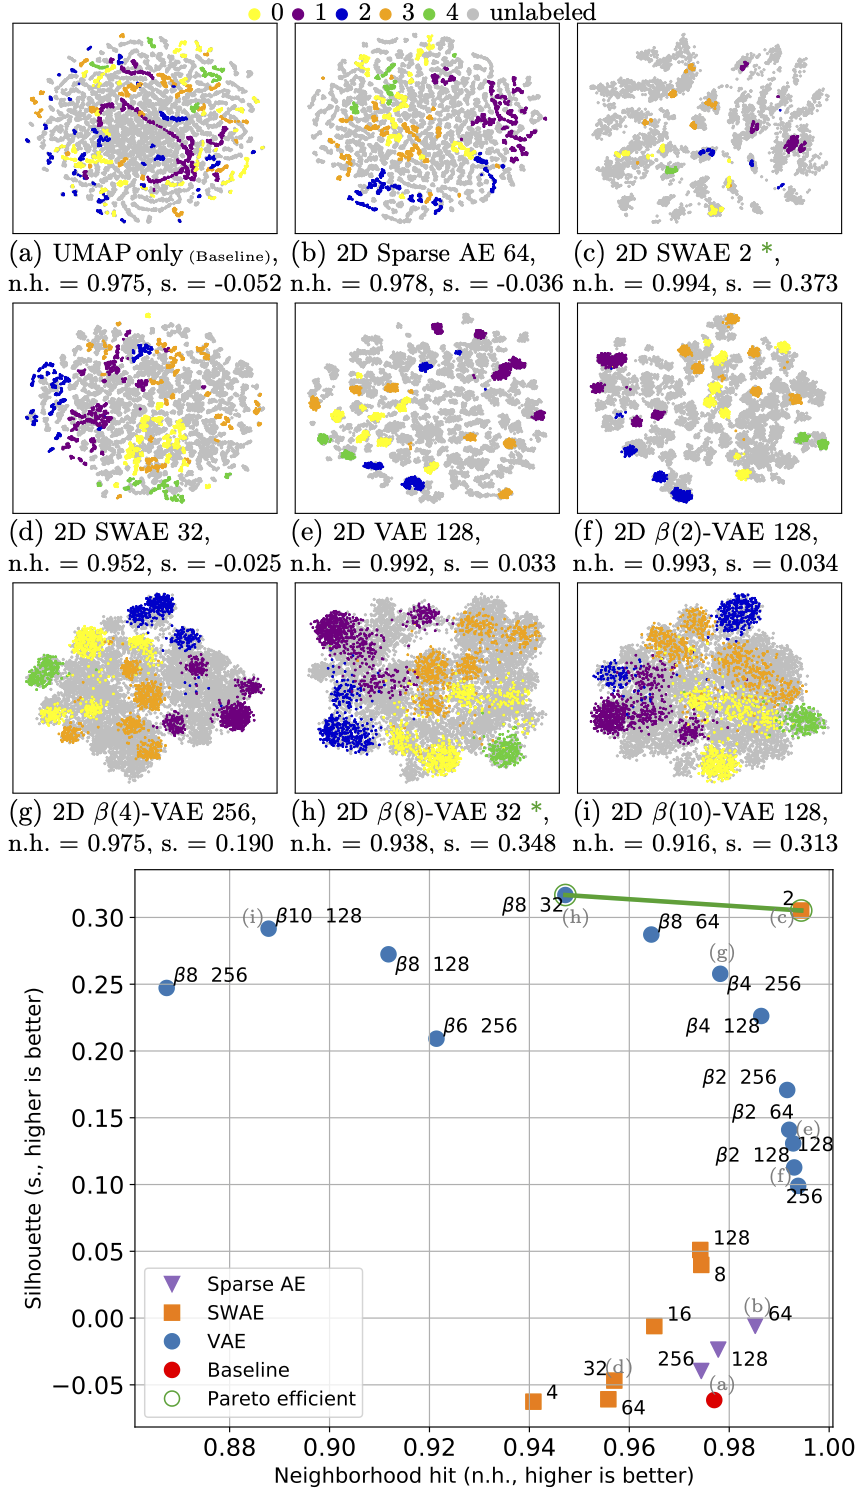
Evaluation and Selection of Autoencoders for Expressive Dimensionality Reduction of Spatial Ensembles
H. Gadirov, G. Tkachev, T. Ertl, S. Frey
This paper evaluates how autoencoder variants with different architectures and parameter settings affect the quality of 2D projections for spatial ensembles, and proposes a guided selection approach based on partially labeled data. Extracting features with autoencoders prior to applying techniques like UMAP substantially enhances the projection results and better conveys spatial structures and spatio-temporal behavior. Our comprehensive study demonstrates substantial impact of different variants, and shows that it is highly data-dependent which ones yield the best possible projection results. We propose to guide the selection of an autoencoder configuration for a specific ensemble based on projection metrics. These metrics are based on labels, which are however prohibitively time-consuming to obtain for the full ensemble. Addressing this, we demonstrate that a small subset of labeled members suffices for choosing an autoencoder configuration. We discuss results featuring various types of autoencoders applied to two fundamentally different ensembles featuring thousands of members: channel structures in soil from Markov chain Monte Carlo and time-dependent experimental data on droplet-film interaction.
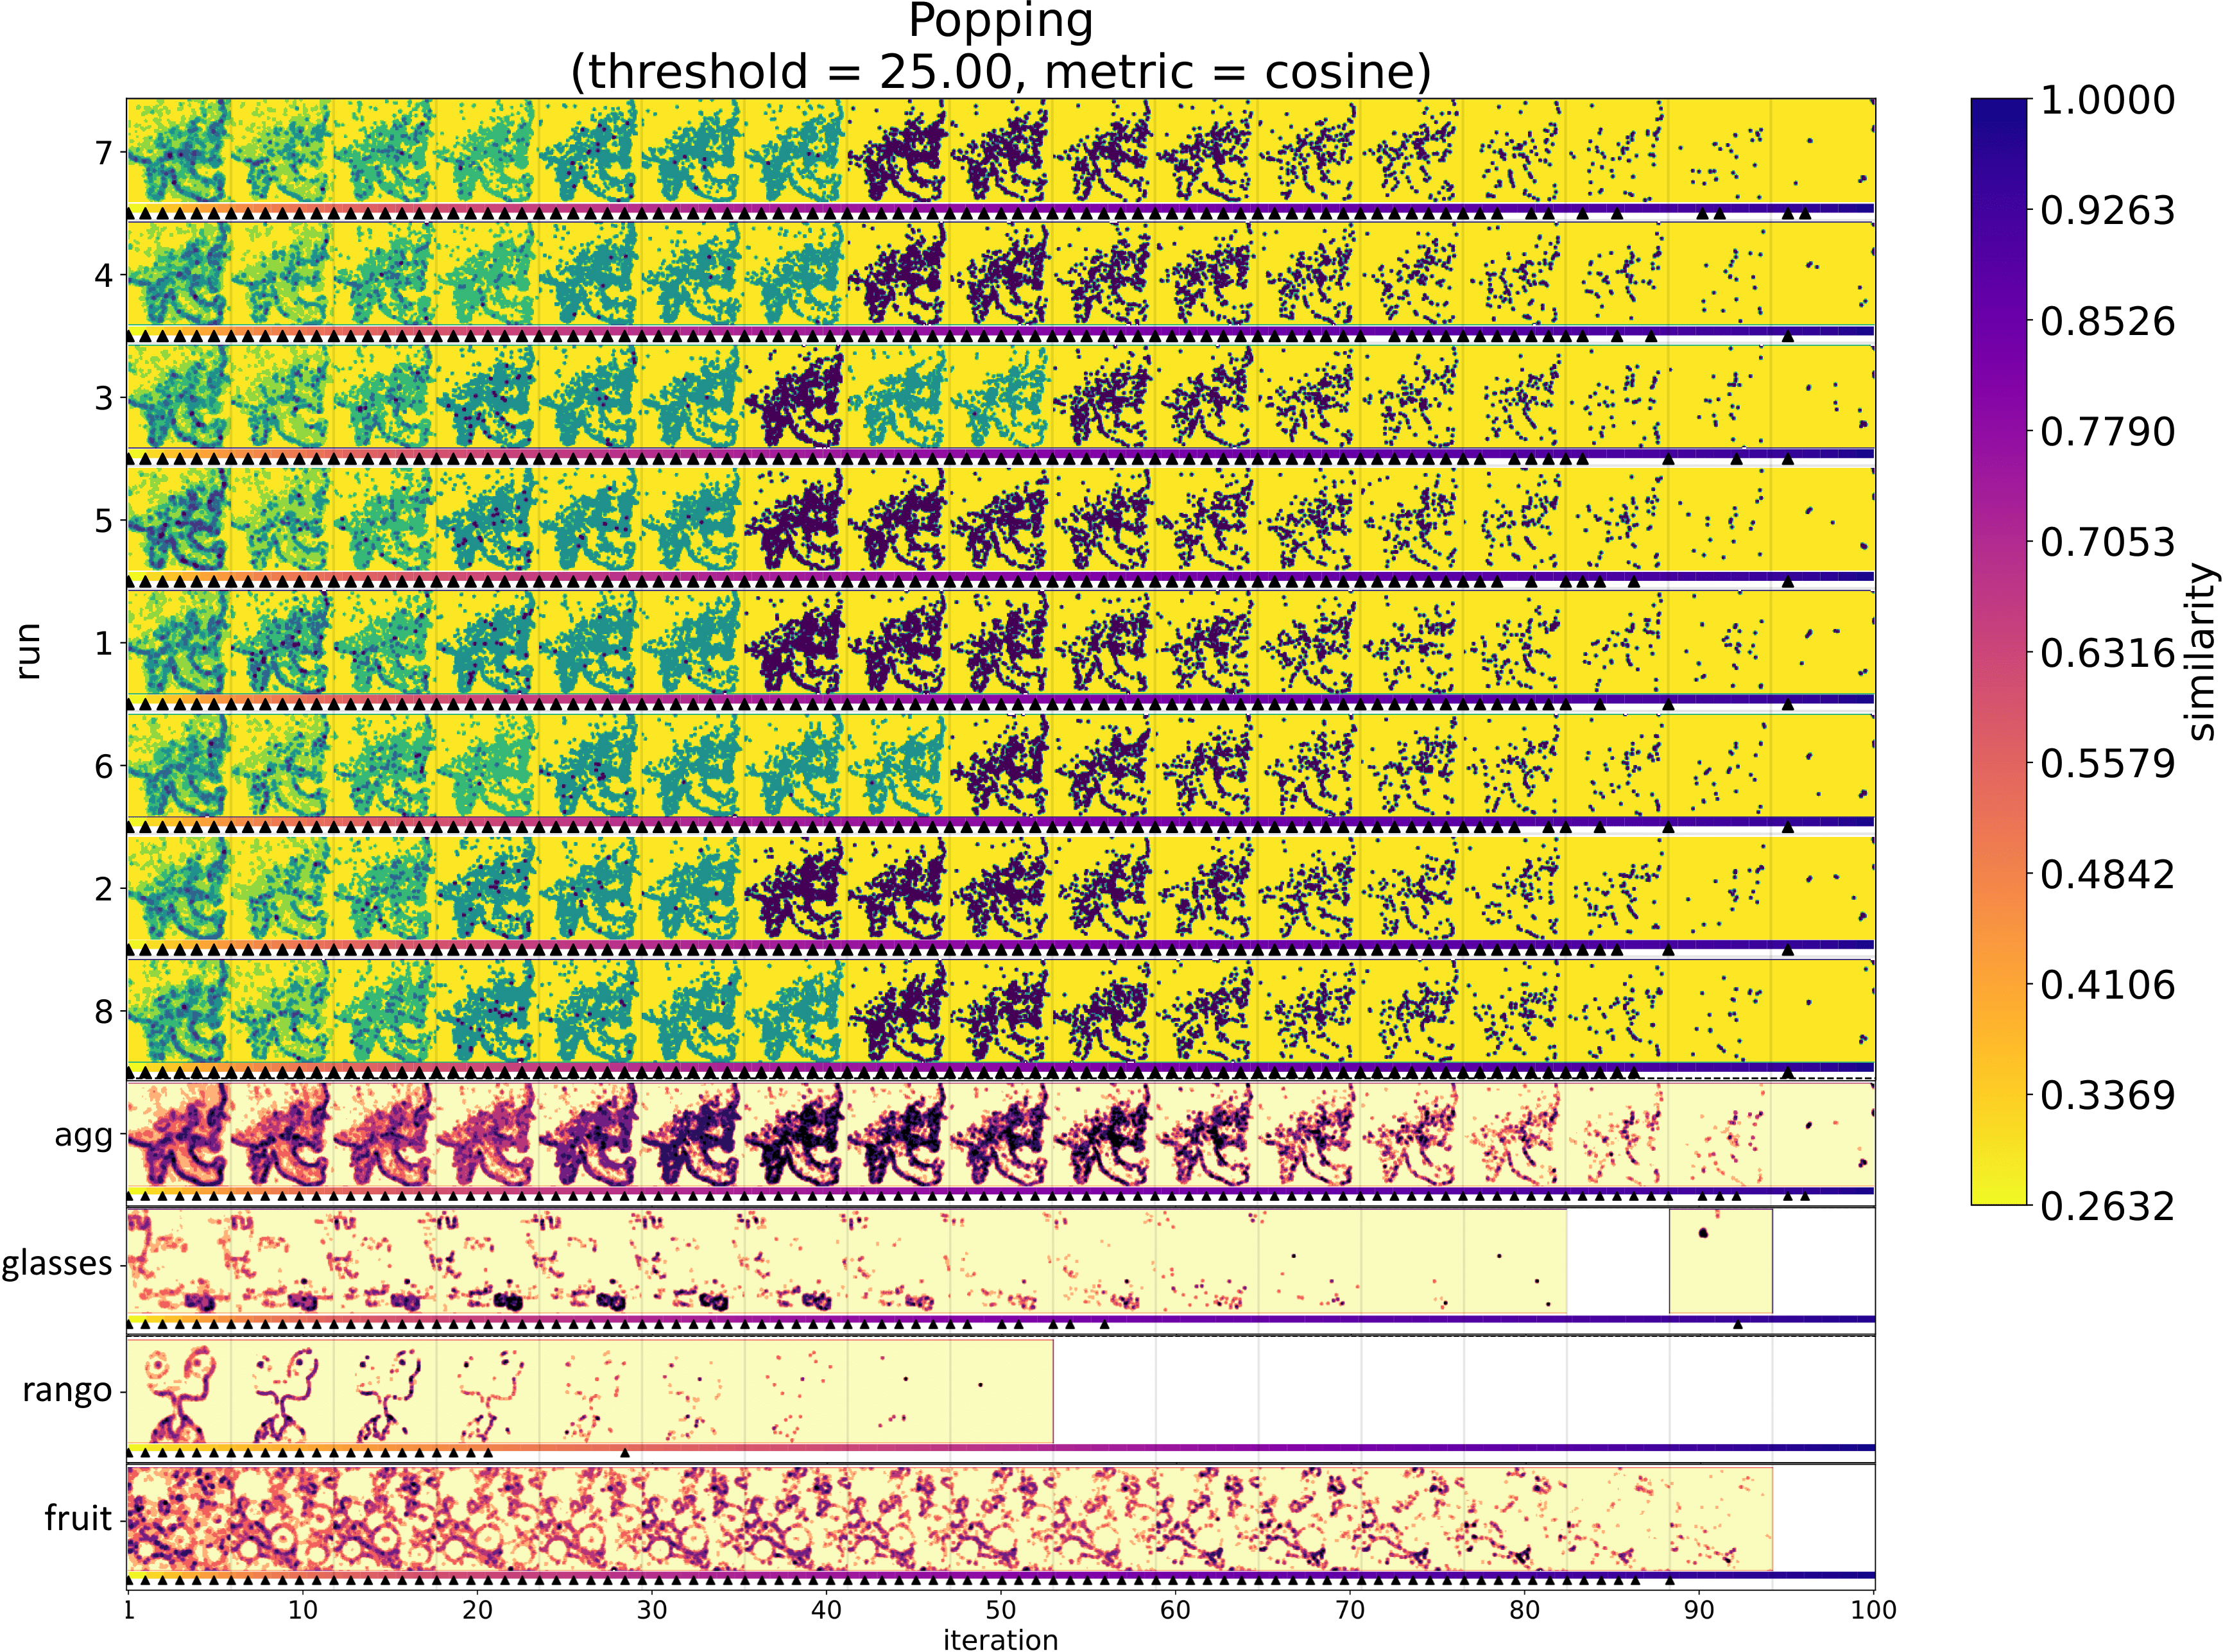
Visual Analysis of Popping in Progressive Visualization
E. Waterink, J. Kosinka, S. Frey
Progressive visualization allows users to examine intermediate results while they are further refined in the background.
This makes them increasingly popular when dealing with large data and computationally expensive tasks.
The characteristics of how preliminary visualizations evolve over time are crucial for efficient analysis; in particular unexpected disruptive changes between iterations can significantly hamper the user experience.
This paper proposes a visualization framework to analyze the refinement behavior of progressive visualization.
We particularly focus on sudden significant changes between the iterations, which we denote as popping artifacts, in reference to undesirable visual effects in the context of level of detail representations in computer graphics.
Our visualization approach conveys where in image space and when during the refinement popping artifacts occur.
It allows to compare across different runs of stochastic processes, and supports parameter studies for gaining further insights and tuning the algorithms under consideration.
We demonstrate the application of our framework and its effectiveness via two diverse use cases with underlying stochastic processes: adaptive image space sampling, and the generation of grid layouts.
S4: Self-Supervised learning of Spatiotemporal Similarity
G. Tkachev, S. Frey, T. Ertl
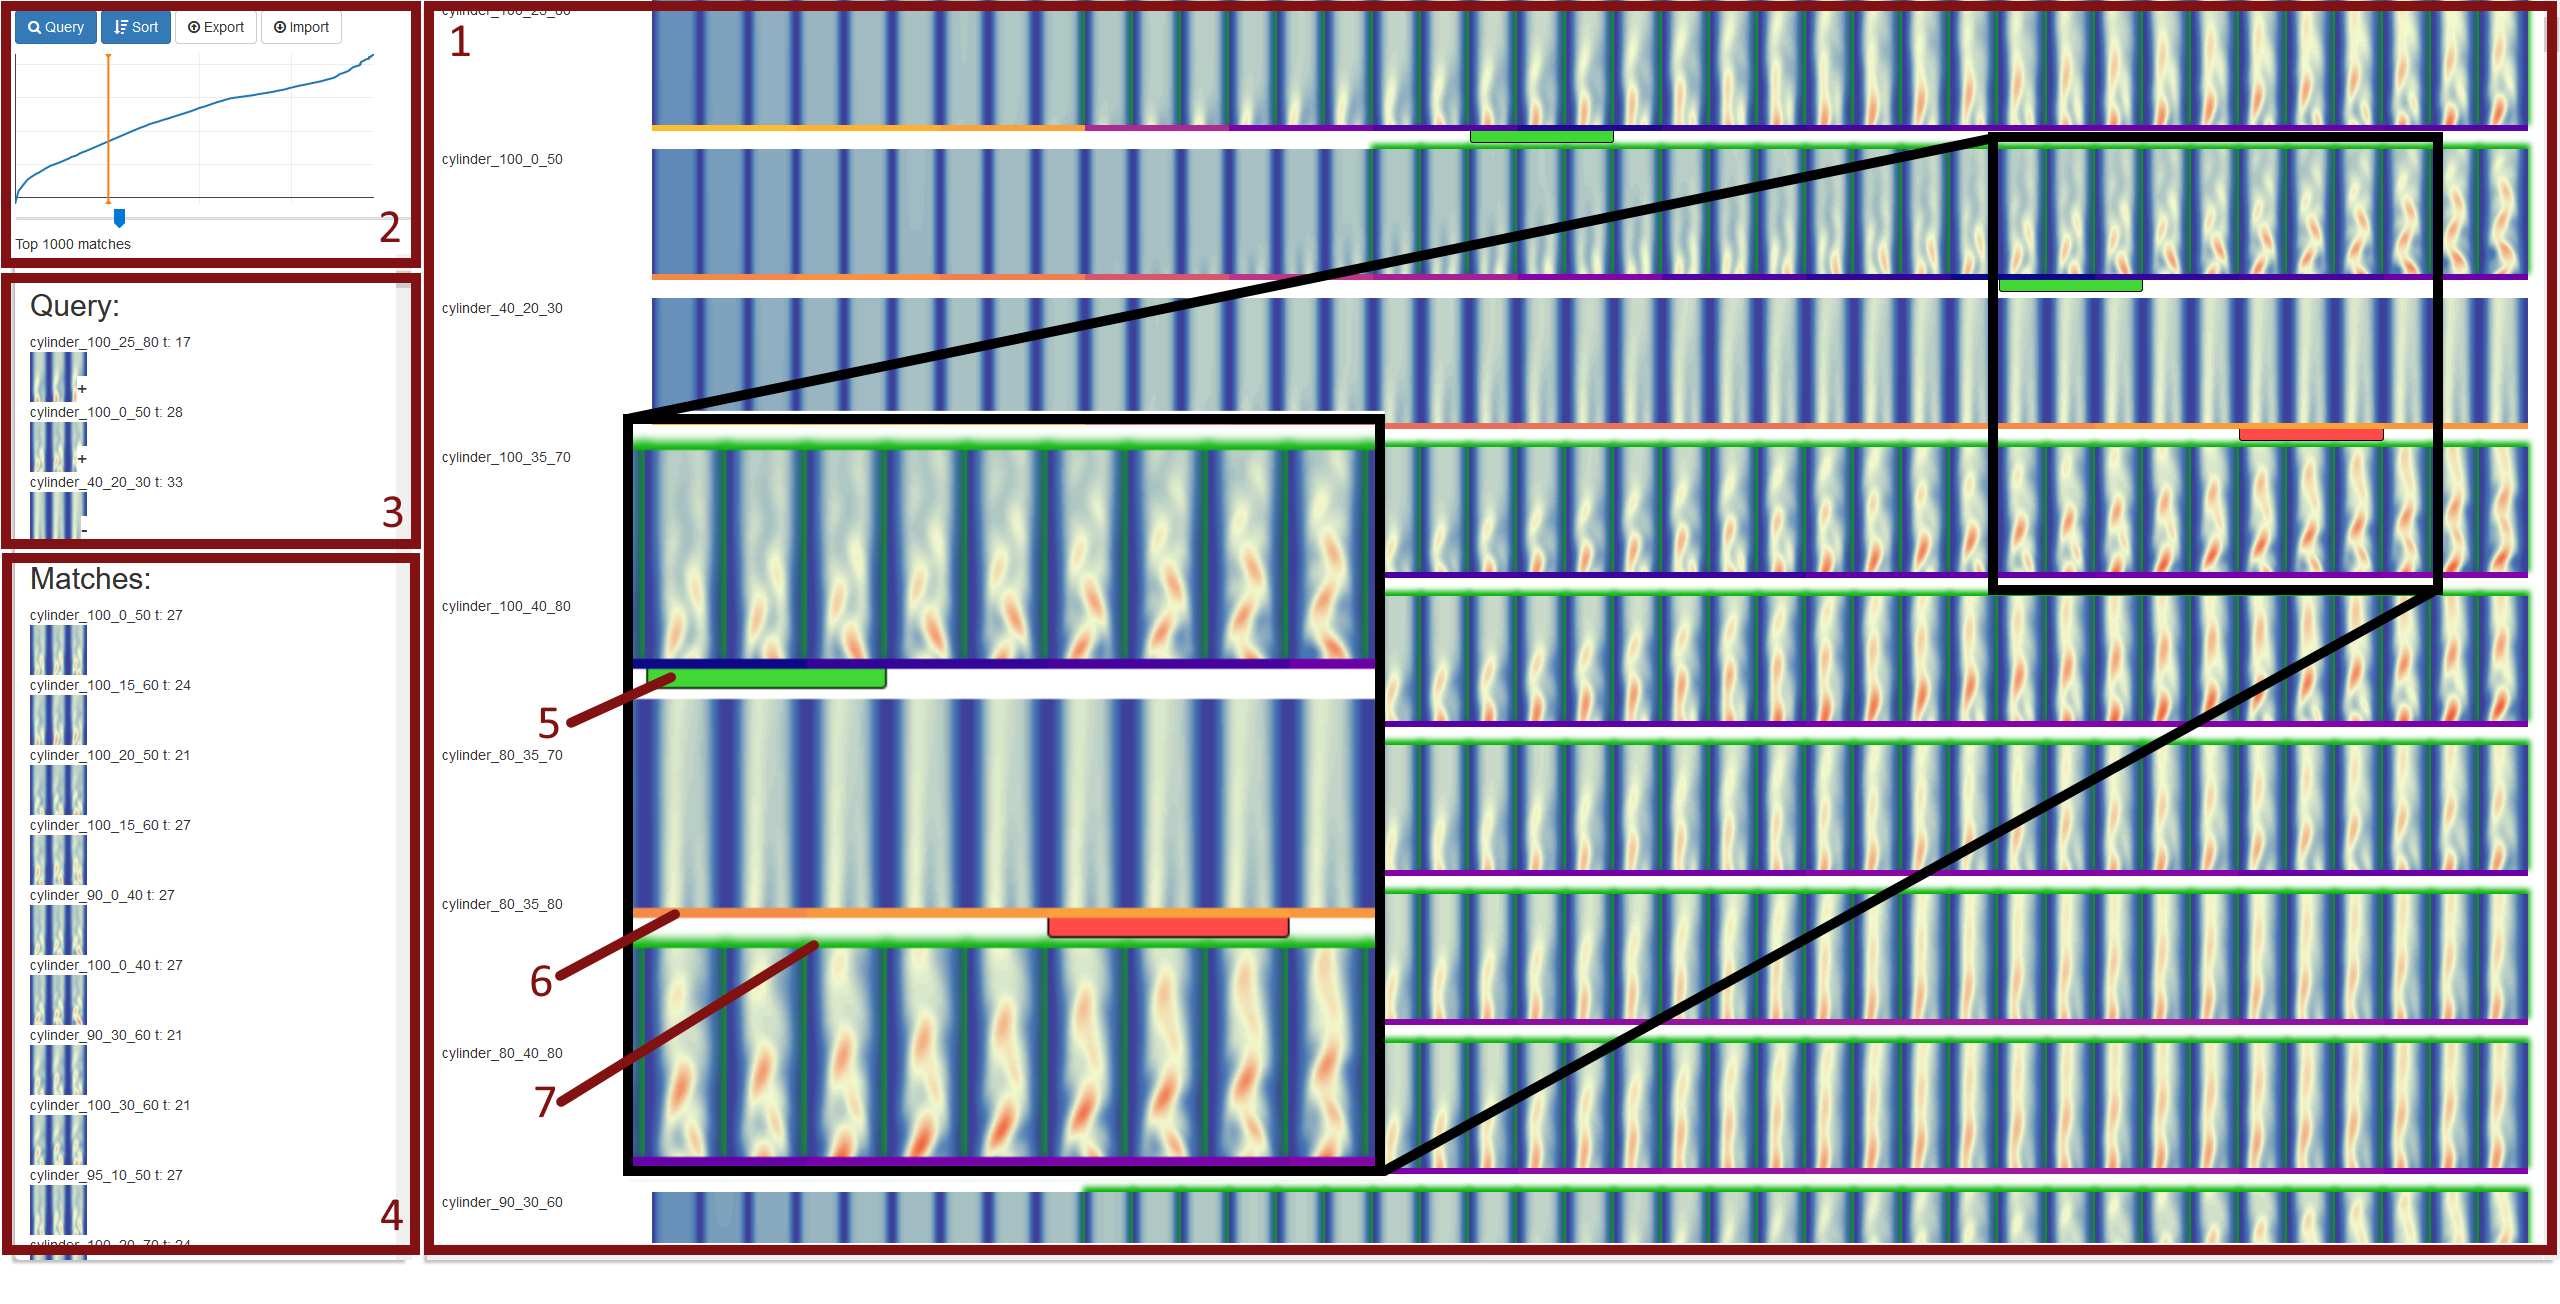
We introduce an ML-driven approach that enables interactive example-based queries for similar behavior in ensembles of spatiotemporal scientific data. This addresses an important use case in the visual exploration of simulation and experimental data, where data is often large, unlabeled and has no meaningful similarity measures available. We exploit the fact that nearby locations often exhibit similar behavior and train a Siamese Neural Network in a self-supervised fashion, learning an expressive latent space for spatiotemporal behavior. This space can be used to find similar behavior with just a few user-provided examples. We evaluate this approach on several ensemble datasets and compare with multiple existing methods, showing both qualitative and quantitative results.
Visual analysis of droplet dynamics in large-scale multiphase spray simulations
M. Heinemann, S. Frey, G. Tkachev, A. Straub, F.Sadlo, T. Ertl
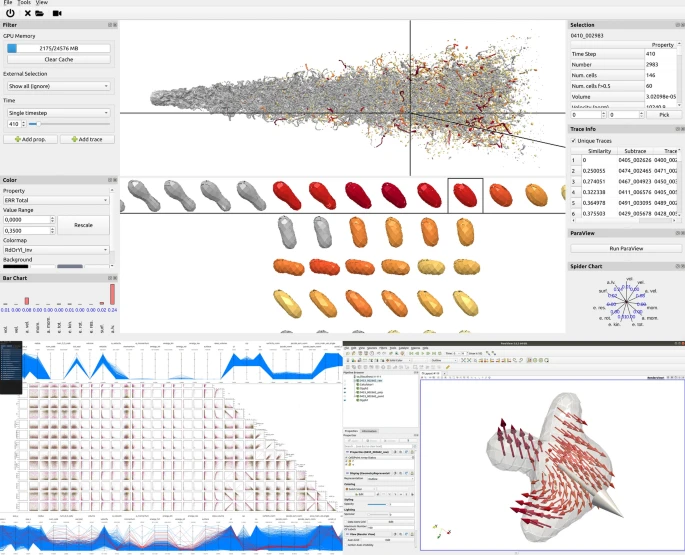
We present a data-driven visual analysis approach for the in-depth exploration of large numbers of droplets. Understanding droplet dynamics in sprays is of interest across many scientific fields for both simulation scientists and engineers. In this paper, we analyze large-scale direct numerical simulation datasets of the two-phase flow of non-Newtonian jets. Our interactive visual analysis approach comprises various dedicated exploration modalities that are supplemented by directly linking to ParaView. This hybrid setup supports a detailed investigation of droplets, both in the spatial domain and in terms of physical quantities . Considering a large variety of extracted physical quantities for each droplet enables investigating different aspects of interest in our data. To get an overview of different types of characteristic behaviors, we cluster massive numbers of droplets to analyze different types of occurring behaviors via domain-specific pre-aggregation, as well as different methods and parameters. Extraordinary temporal patterns are of high interest, especially to investigate edge cases and detect potential simulation issues. For this, we use a neural network-based approach to predict the development of these physical quantities and identify irregularly advected droplets.
The Complexity of Porous Media Flow Characterized in a Microfluidic Model Based on Confocal Laser Scanning Microscopy and Micro‐PIV
D. A. M. de Winter, K. Weishaupt, S. Scheller, S. Frey, A. Raoof, S. M. Hassanizadeh, R. Helmig
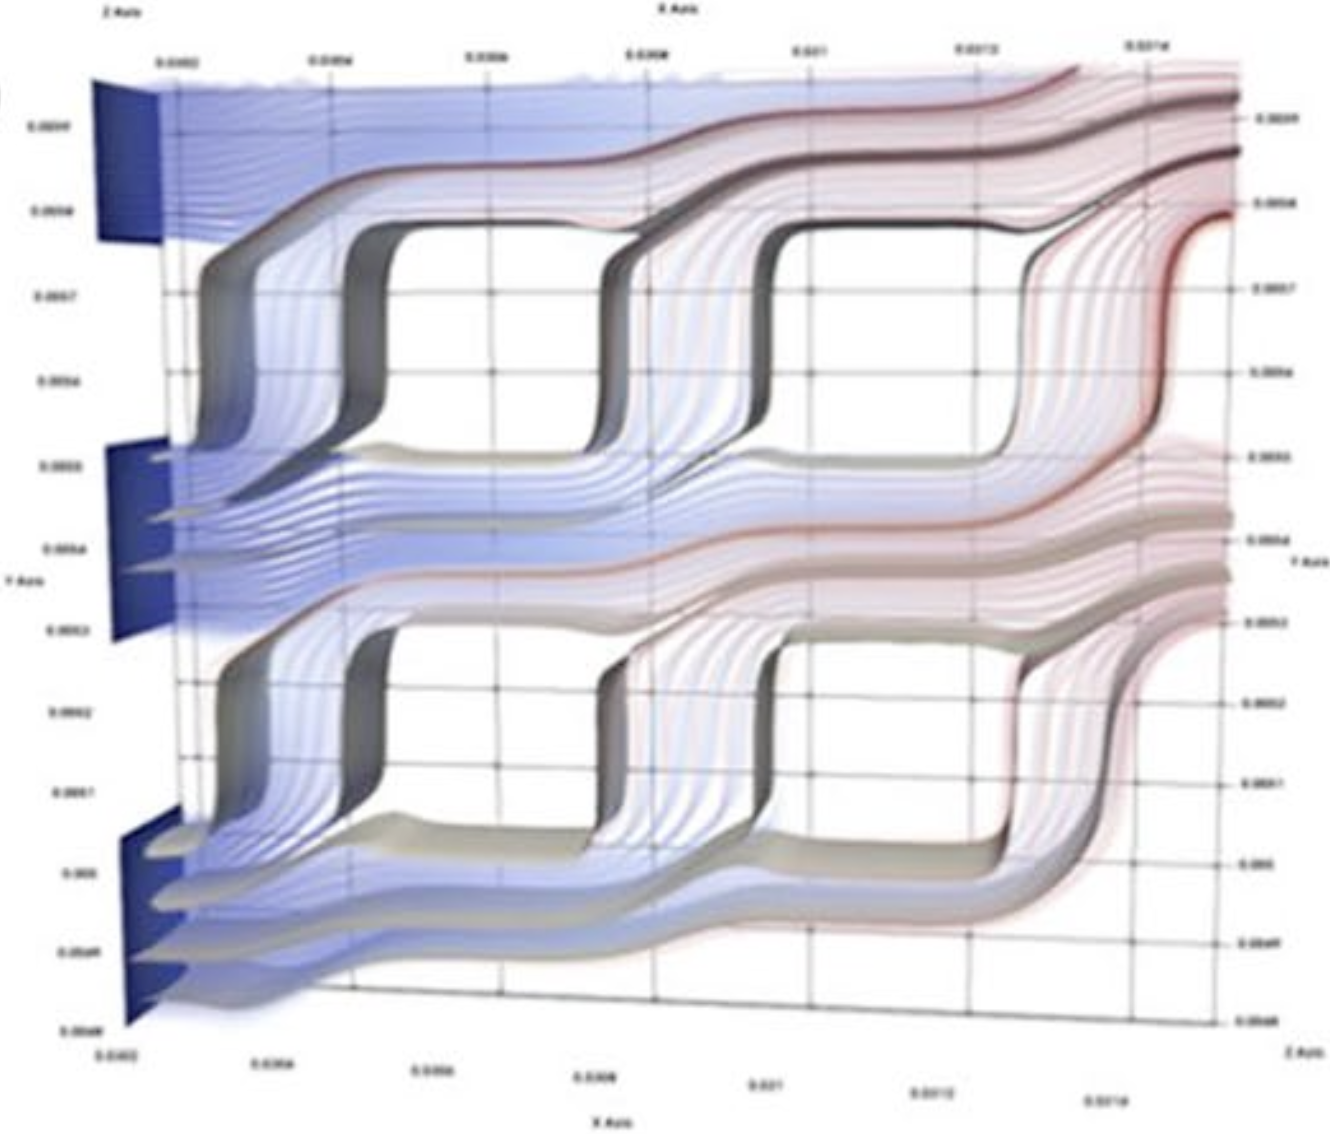
In this study, the complexity of a steady-state flow through porous media is revealed using confocal laser scanning microscopy (CLSM). Micro-particle image velocimetry (micro- PIV) is applied to construct movies of colloidal particles. The calculated velocity vec- tor fields from images are further utilized to obtain laminar flow streamlines. Fluid flow through a single straight channel is used to confirm that quantitative CLSM measurements can be conducted. Next, the coupling between the flow in a channel and the movement within an intersecting dead-end region is studied. Quantitative CLSM measurements con- firm the numerically determined coupling parameter from earlier work of the authors. The fluid flow complexity is demonstrated using a porous medium consisting of a regular grid of pores in contact with a flowing fluid channel. The porous media structure was further used as the simulation domain for numerical modeling. Both the simulation, based on solv- ing Stokes equations, and the experimental data show presence of non-trivial streamline trajectories across the pore structures. In view of the results, we argue that the hydrody- namic mixing is a combination of non-trivial streamline routing and Brownian motion by pore-scale diffusion. The results provide insight into challenges in upscaling hydrodynamic dispersion from pore scale to representative elementary volume (REV) scale. Furthermore, the successful quantitative validation of CLSM-based data from a microfluidic model fed by an electrical syringe pump provided a valuable benchmark for qualitative validation of computer simulation results.
2020
Foveated Encoding for Large High-Resolution Displays
F. Frieß, M. Braun, V. Bruder, S. Frey, G. Reina, T. Ertl
DOI: 10.1109/TVCG.2020.3030445 | LDAV best paper
IEEE Transactions on Visualization and Computer Graphics
LDAV 2020
IEEE Transactions on Visualization and Computer Graphics
LDAV 2020
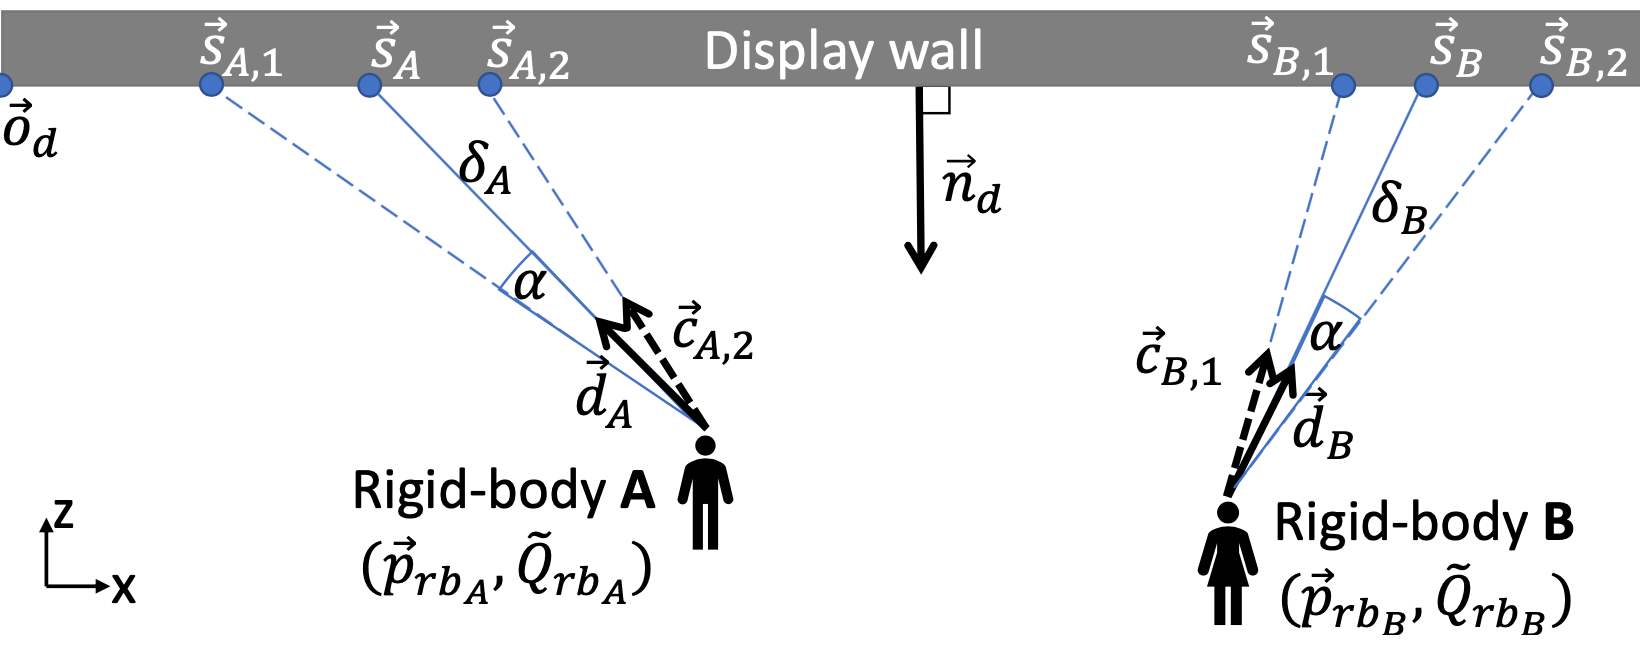
Collaborative exploration of scientific data sets across large high-resolution displays requires both high visual detail as well as low-latency transfer of image data (oftentimes inducing the need to trade one for the other). In this work, we present a system that dynamically adapts the encoding quality in such systems in a way that reduces the required bandwidth without impacting the details perceived by one or more observers. Humans perceive sharp, colourful details, in the small foveal region around the centre of the field of view, while information in the periphery is perceived blurred and colourless. We account for this by tracking the gaze of observers, and respectively adapting the quality parameter of each macroblock used by the H.264 encoder, considering the so-called visual acuity fall-off. This allows to substantially reduce the required bandwidth with barely noticeable changes in visual quality, which is crucial for collaborative analysis across display walls at different locations. We demonstrate the reduced overall required bandwidth and the high quality inside the foveated regions using particle rendering and parallel coordinates.
Temporally Dense Exploration of Moving and Deforming Shapes
S. Frey
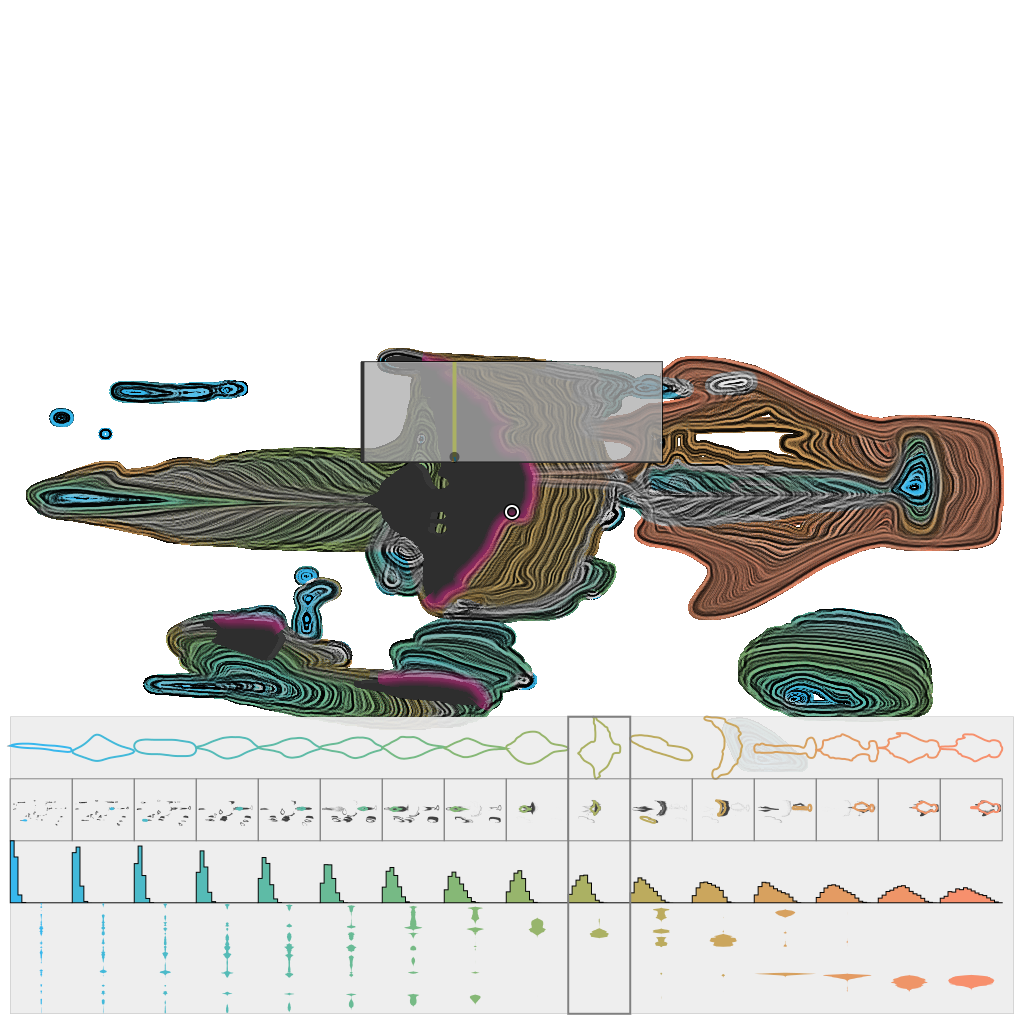
We present our approach for the dense visualization and temporal exploration of moving and deforming shapes from scientific experiments and simulations. Our image space representation is created by convolving a noise texture along shape contours (akin to LIC). Beyond indicating spatial structure via luminosity, we additionally use colour to depict time or classes of shapes via automatically customized maps. This representation summarizes temporal evolution, and provides the basis for interactive user navigation in the spatial and temporal domain in combination with traditional renderings. Our efficient implementation supports the quick and progressive generation of our representation in parallel as well as adaptive temporal splits to reduce overlap. We discuss and demonstrate the utility of our approach using 2D and 3D scalar fields from experiments and simulations.
A terminology for in situ visualization and analysis systems
H. Childs et al.
The term "in situ processing" has evolved over the last decade to mean both a specific strategy for visualizing and analyzing data and an umbrella term for a processing paradigm. The resulting confusion makes it difficult for visualization and analysis scientists to communicate with each other and with their stakeholders. To address this problem, a group of over 50 experts convened with the goal of standardizing terminology. This paper summarizes their findings and proposes a new terminology for describing in situ systems. An important finding from this group was that in situ systems are best described via multiple, distinct axes: integration type, proximity, access, division of execution, operation controls, and output type. This paper discusses these axes, evaluates existing systems within the axes, and explores how currently used terms relate to the axes.

Trade-offs and Parameter Adaptation in In Situ Visualization
S. Frey, V. Bruder, F. Frieß, P. Gralka, T. Rau, T. Ertl, G. Reina
Chapter in the book In Situ Visualization for Computational Science (Publisher: Springer)
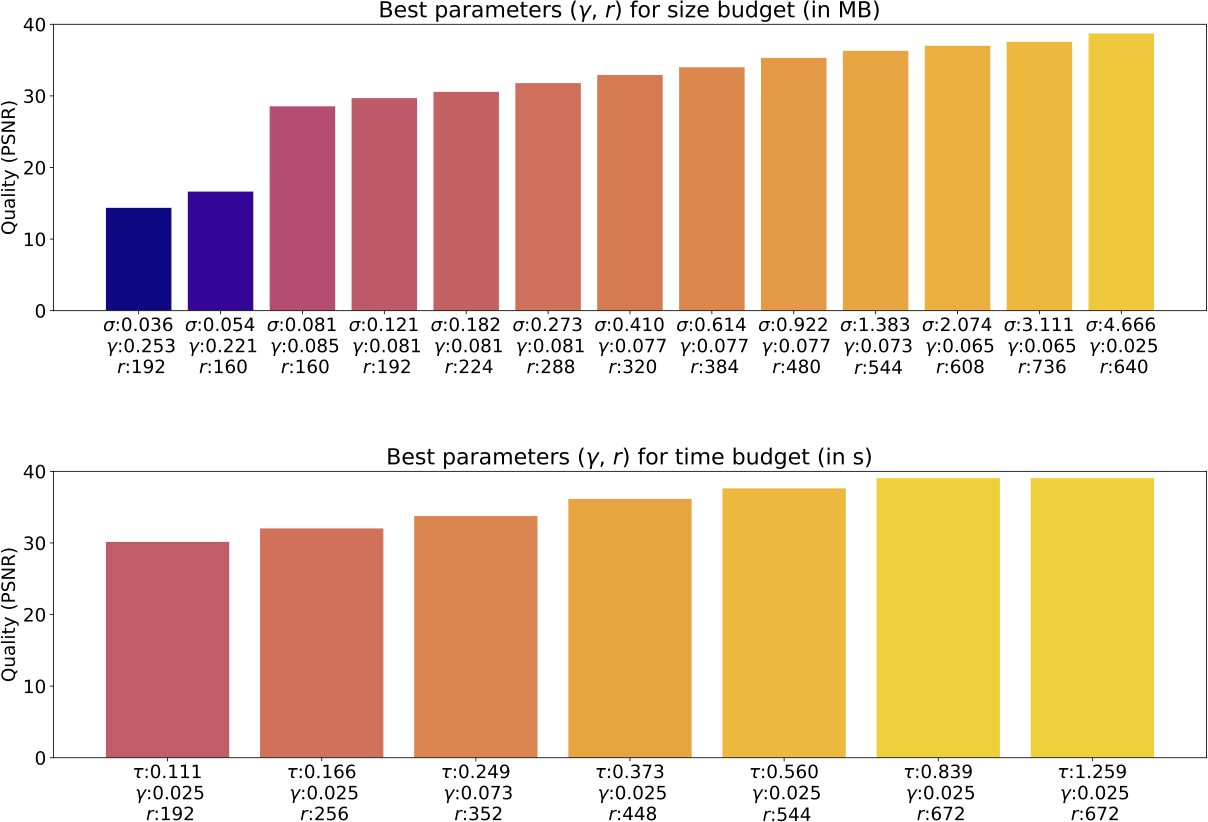
This chapter discusses trade-offs and parameter tuning in in situ visualization, with an emphasis on rendering quality and workload distribution.
Four different use cases are analyzed with respect to the characteristics of configuration changes, and the design as well as dynamic adaptation choices following from this. First, the performance impact of load balancing and resource allocation variants on the simulation and the visualization is investigated using the visualization framework MegaMol. Its loose coupling scheme and architecture enable minimally invasive in situ operation without impacting the stability of the simulation with (potentially) experimental visualization code. Second, Volumetric Depth Images (VDIs) are considered: a compact, view-dependent intermediate representation that can efficiently be generated and used for a posteriori exploration. A study of their inherent trade-offs regarding size, quality, and generation time provides the basis for parameter optimization. Third, streaming for remote visualization allows a user to monitor the progress of the simulation and to steer visualization parameters. Compression settings are adapted dynamically based on predictions via convolutional neural networks across different parts of images to achieve high frame rates for high-resolution displays like powerwalls. Fourth, different performance prediction models for volume rendering address offline scenarios (like hardware acquisition planning) as well as dynamic adaptation of parameters and load balancing. Finally, the chapter concludes by summarizing overarching approaches and challenges, and discussing the potential role that adaptive approaches can play in increasing the efficiency of in situ visualization.
Visual Analysis of Structure Formation in Cosmic Evolution
K. Schatz, C. Müller, P. Gralka, M. Heinemann, A. Straub, C. Schulz, M. Braun, T. Rau, M. Becher,
P. Diehl, D. Marcello, J. Frank, T. Müller, S. Frey, G. Reina, D. Weiskopf, T. Ertl
P. Diehl, D. Marcello, J. Frank, T. Müller, S. Frey, G. Reina, D. Weiskopf, T. Ertl
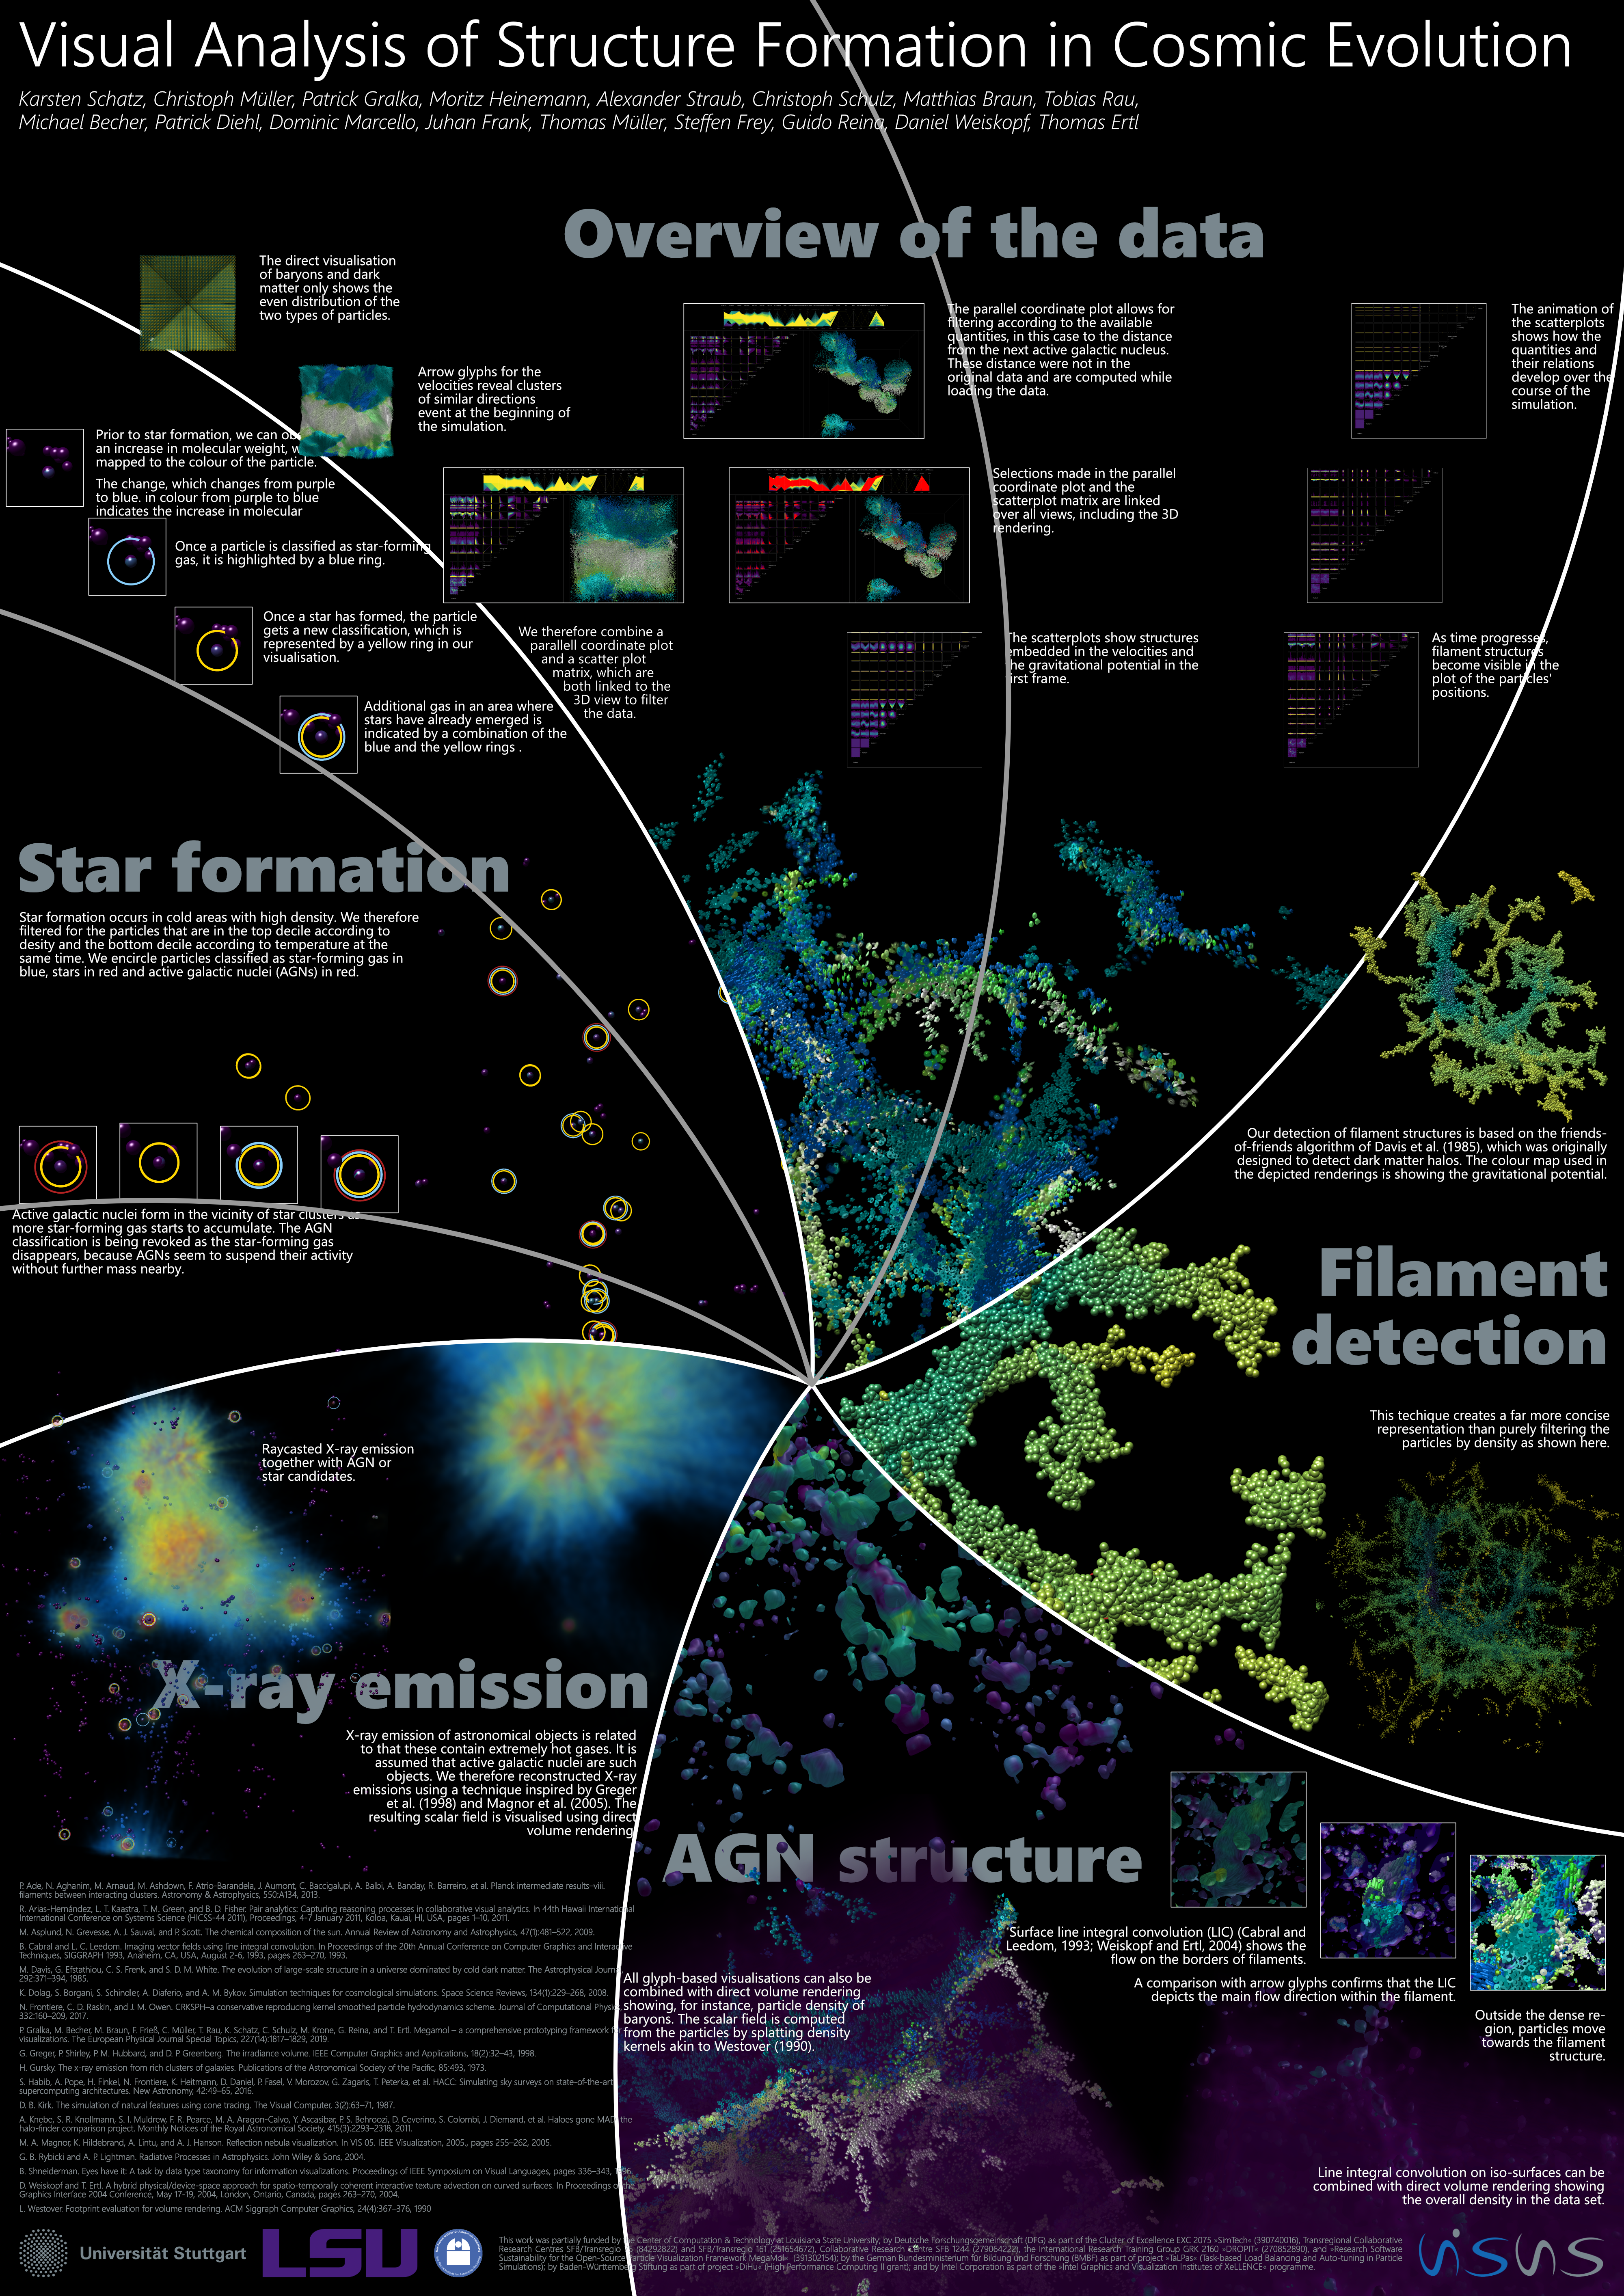
The IEEE SciVis 2019 Contest targets the visual analysis of structure formation in the cosmic evolution of the universe from when the universe was five million years old up to now. In our submission, we analyze high-dimensional data to get an overview, then investigate the impact of Active Galactic Nuclei (AGNs) using various visualization techniques, for instance, an adapted filament filtering method for detailed analysis and particle flow in the vicinity of filaments. Based on feedback from domain scientists on these initial visualizations, we also analyzed X-ray emissions and star formation areas. The conversion of star-forming gas to stars and the resulting increasing molecular weight of the particles could be observed.
Datenmanagement im SFB 1313
S. Hermann, M. Schneider, B. Flemisch, S. Frey, D. Iglezakis, M. Ruf, B. Schembera, A. Seeland, H. Steeb
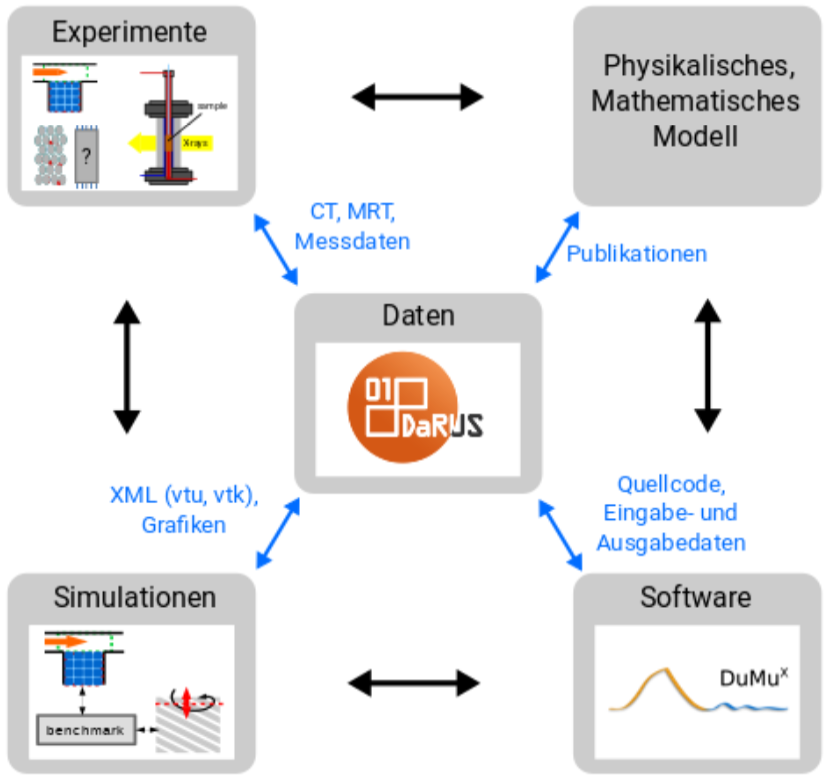
Dieser Artikel gibt einen Überblick über das Forschungsdatenmanagement im SFB 1313. Ein wesentliches Merkmal der geplanten Forschungstätigkeit im SFB ist die Verknüpfung von physikalischen und mathematischen Modellen und den daraus resultierenden Rechenmodellen mit hochaufgelösten Experimenten. Eine solche Verknüpfung stellt diverse Anforderungen an das Forschungsdatenmanagement. Diese Anforderungen sowie die damit einhergehenden Herausforderungen werden in diesem Artikel detailliert beschrieben. In diesem Zusammenhang wird das Datenrepositorium DaRUS vorgestellt, welches die Verwaltung und Beschreibung der im SFB anfallenden Daten ermöglicht. Zusätzlich wird das entwickelte Metadatenschema vorgestellt und auf die geplante automatisierte Metadatenerfassung eingegangen.
2019
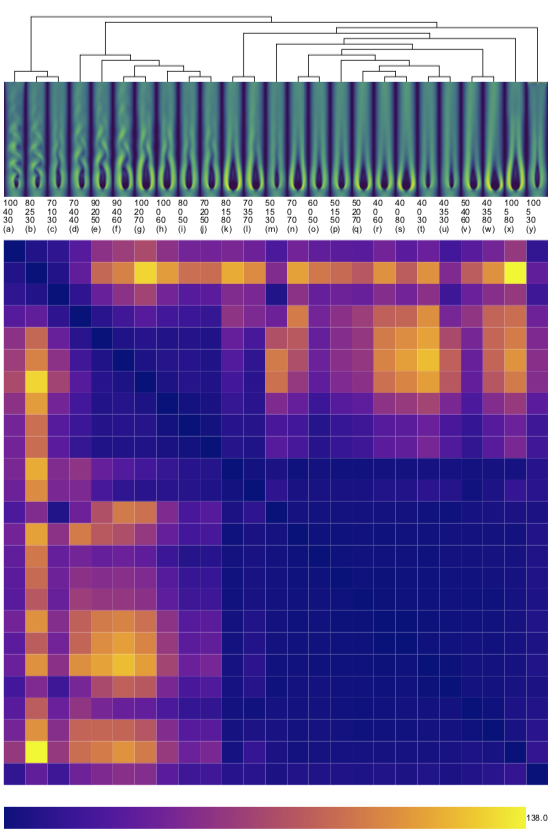
Local Prediction Models for Spatiotemporal Volume Visualization
G. Tkachev, S. Frey, T. Ertl
We present a machine learning-based approach for detecting and visualizing complex behavior in spatiotemporal volumes. For this, we train models to predict future data values at a given position based on the past values in its neighborhood, capturing common temporal behavior in the data. We then evaluate the model’s prediction on the same data. High prediction error means that the local behavior was too complex, unique or uncertain to be accurately captured during training, indicating spatiotemporal regions with interesting behavior. By training several models of varying capacity, we are able to detect spatiotemporal regions of various complexities. We aggregate the obtained prediction errors into a time series or spatial volumes and visualize them together to highlight regions of unpredictable behavior and how they differ between the models. We demonstrate two further volumetric applications: adaptive timestep selection and analysis of ensemble dissimilarity. We apply our technique to datasets from multiple application domains and demonstrate that we are able to produce meaningful results while making minimal assumptions about the underlying data.
The Impact of Work Distribution on In Situ Visualization: A Case Study
T. Rau, P. Gralka, O. Fernandes, G. Reina, S. Frey, T. Ertl
ISAV 2019 | honorable mention
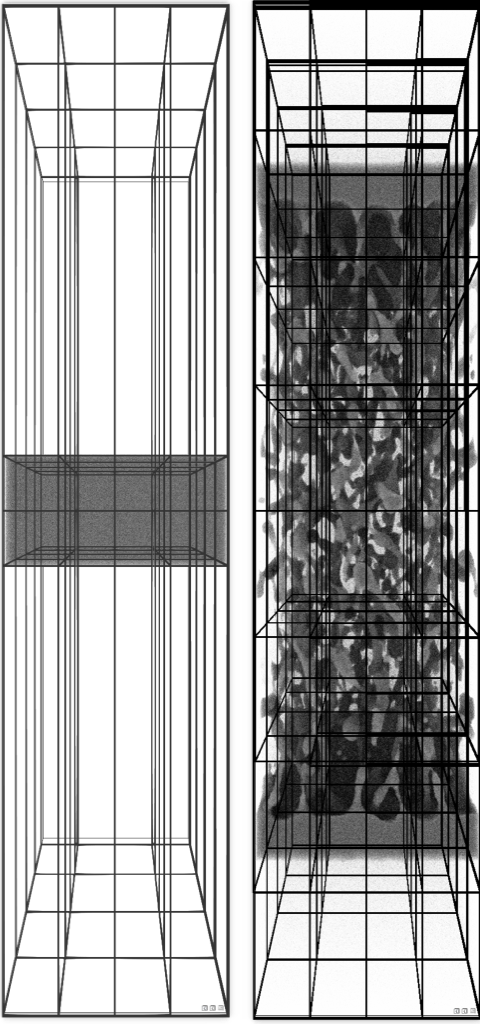
Large-scale computer simulations generate data at rates that necessitate visual analysis tools to run in situ. The distribution of work on and across nodes of a supercomputer is crucial to utilize compute resources as efficiently as possible. In this paper, we study two work distribution problems in the context of in situ visualization and jointly assess the performance impact of different variants. First, especially for simulations involving heterogeneous loads across their domain, dynamic load balancing can significantly reduce simulation run times. However, the adjustment of the domain partitioning associated with this also has a direct impact on visualization performance. The exact impact of this is side effect is largely unclear a priori as generally different criteria are used for balancing simulation and visualization load. Second, on node level, the adequate allocation of threads to simulation or visualization tasks minimizes the performance drain of the simulation while also enabling timely visualization results. In our case study, we jointly study both work distribution aspects with the visualization framework MegaMol coupled in situ on node level to the molecular dynamics simulation ls1 Mardyn on Stampede2 at TACC.
Visual Representation of Region Transitions in Multi-dimensional Parameter Spaces
O. Fernandes, S. Frey, G. Reina, T. Ertl
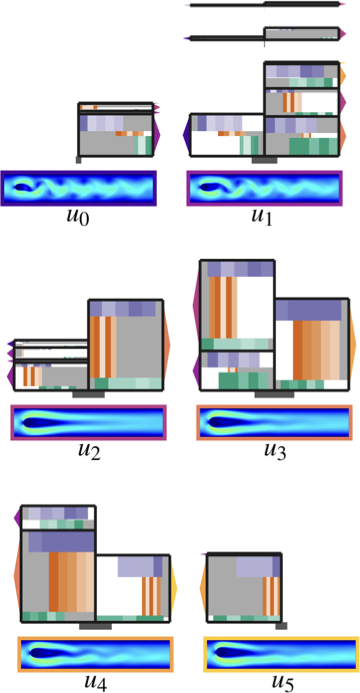
We propose a novel visual representation of transitions between homogeneous regions in multi-dimensional parameter space.
While our approach is generally applicable for the analysis of arbitrary continuous parameter spaces, we particularly focus on scientific applications, like physical variables in simulation ensembles.
To generate our representation, we use unsupervised learning to cluster the ensemble members according to their mutual similarity.
In doing this, clusters are sorted such that similar clusters are located next to each other.
We then further partition the clusters into connected regions with respect to their location in parameter space.
In the visualization, the resulting regions are represented as glyphs in a matrix, indicating parameter changes which induce a transition to another region.
To unambiguously associate a change of data characteristics to a single parameter, we specifically isolate changes by dimension.
With this, our representation provides an intuitive visualization of the parameter transitions that influence the outcome of the underlying simulation or measurement.
We demonstrate the generality and utility of our approach on diverse types of data, namely simulations from the field of computational fluid dynamics and thermodynamics, as well as an ensemble of raycasting performance data.
Voronoi-Based Foveated Volume Rendering
V. Bruder, C. Schulz, R. Bauer, S. Frey, D. Weiskopf, T. Ertl
EuroVis 2019 | best short paper
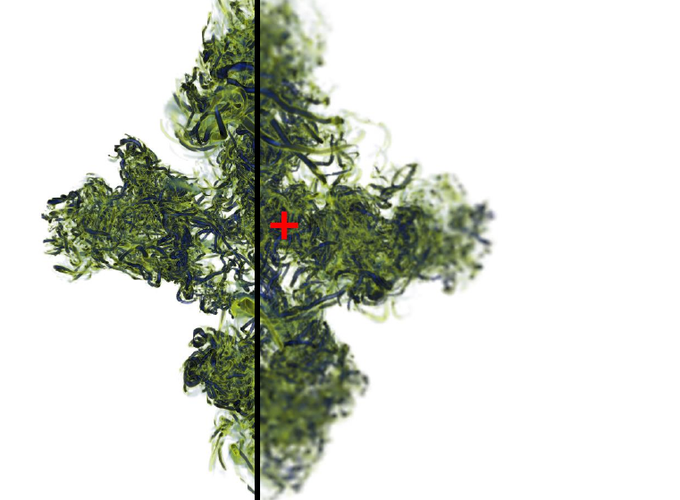
Foveal vision is located in the center of the field of view with a rich impression of detail and color, whereas peripheral vision occurs on the side with more fuzzy and colorless perception. This visual acuity fall-off can be used to achieve higher frame rates by adapting rendering quality to the human visual system. Volume raycasting has unique characteristics, preventing a direct transfer of many traditional foveated rendering techniques. We present an approach that utilizes the visual acuity fall-off to accelerate volume rendering based on Linde-Buzo-Gray sampling and natural neighbor interpolation. First, we measure gaze using a stationary 1200Hz eye-tracking system. Then, we adapt our sampling and reconstruction strategy to that gaze. Finally, we apply a temporal smoothing filter to attenuate undersampling artifacts since peripheral vision is particularly sensitive to contrast changes and movement. Our approach substantially improves rendering performance with barely perceptible changes in visual quality.
Space-Time Volume Visualization of Gaze and Stimulus
V. Bruder, K. Kurzhals, S. Frey, D. Weiskopf, T. Ertl
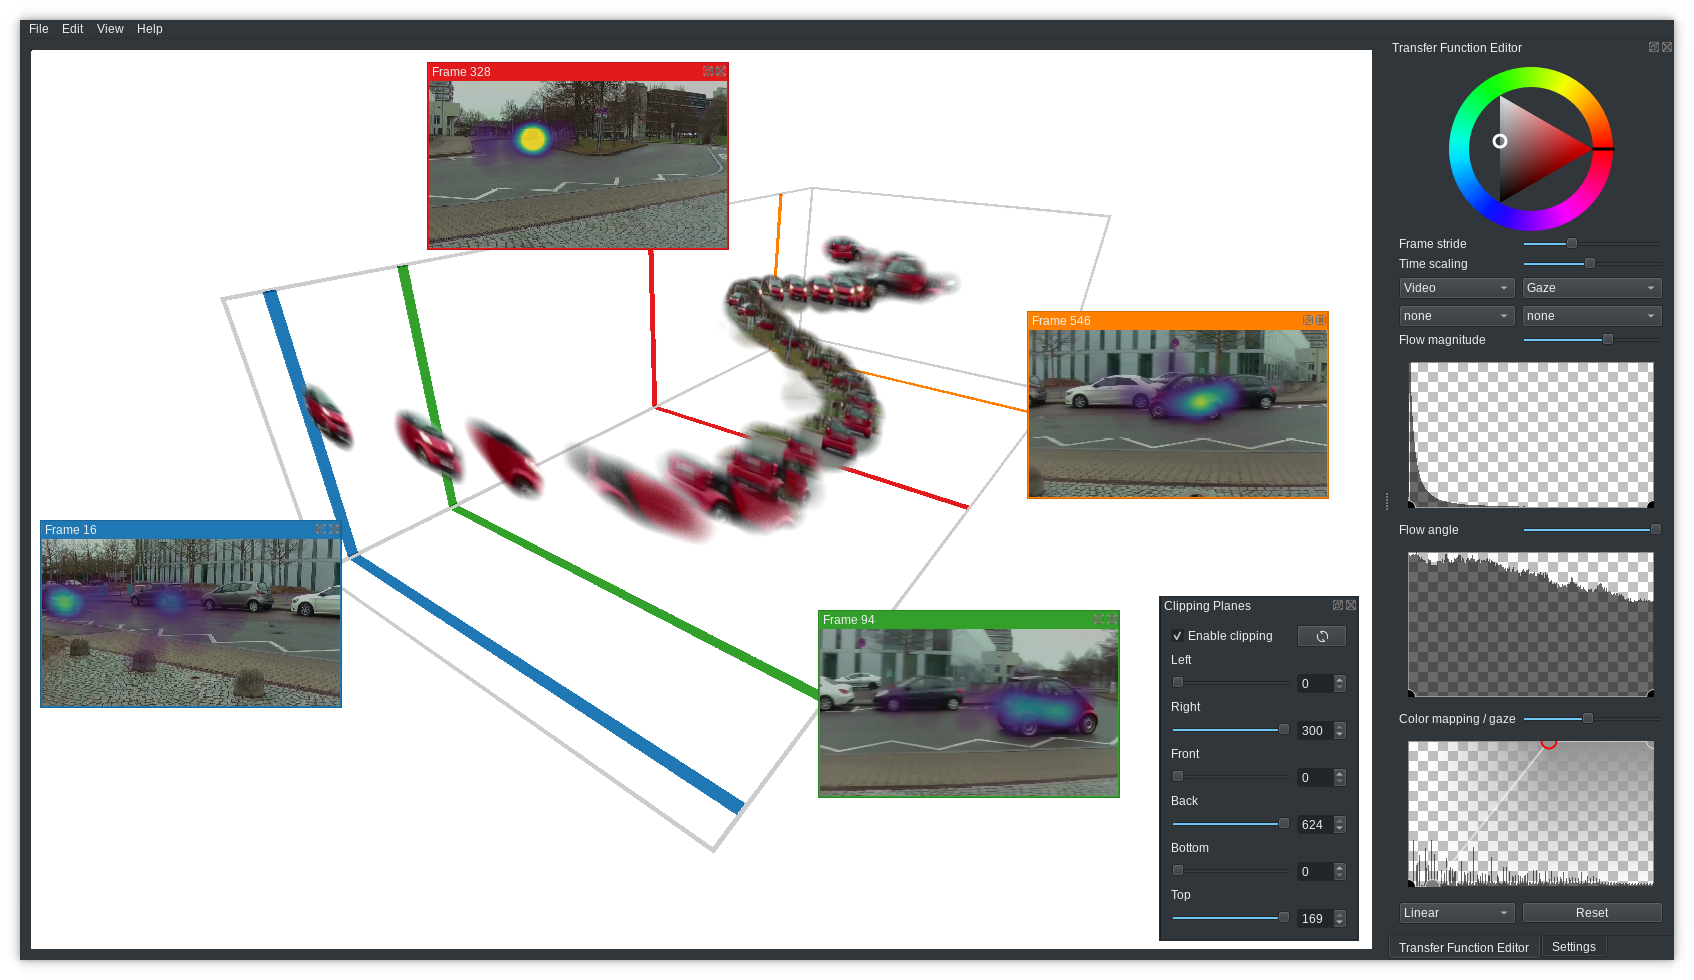
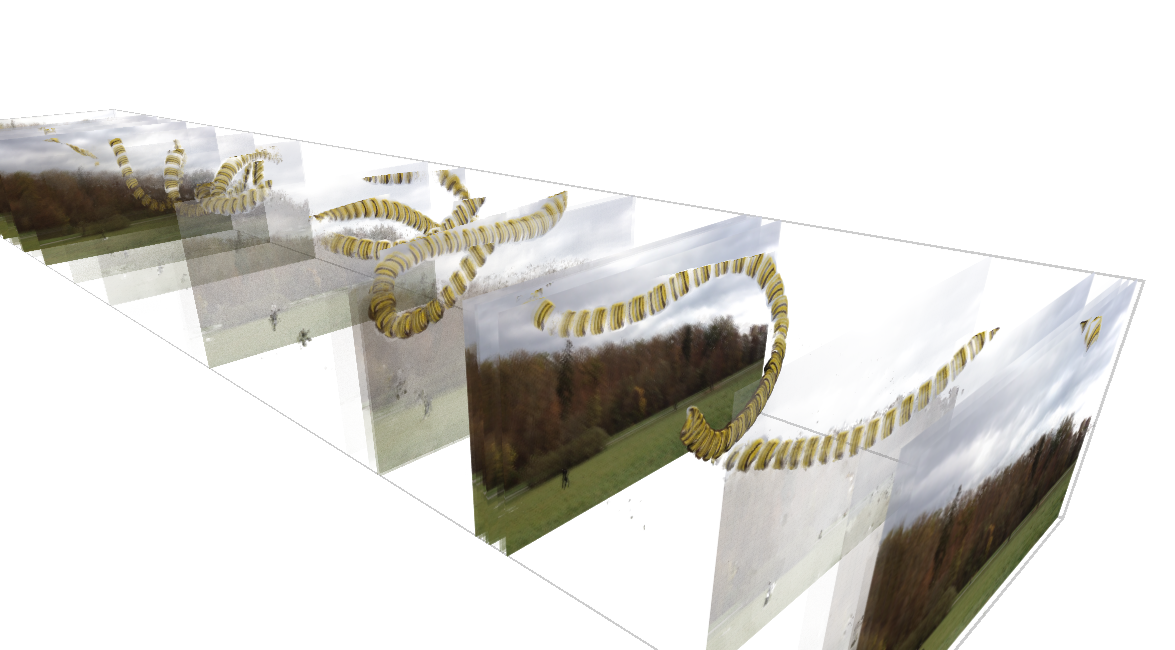
We present an approach for the spatio-temporal analysis of gaze data from multiple participants in the context of a video stimulus. For such data, an overview of the recorded patterns is important to identify common viewing behavior (such as attentional synchrony) and outliers. We adopt the approach of a space-time cube visualization, which extends the spatial dimensions of the stimulus by time as the third dimension. Previous work mainly handled eye-tracking data in the space-time cube as point cloud, providing no information about the stimulus context. This paper presents a novel visualization technique that combines gaze data, a dynamic stimulus, and optical flow with volume rendering to derive an overview of the data with contextual information. With specifically designed transfer functions, we emphasize different data aspects, making the visualization suitable for explorative analysis and for illustrative support of statistical findings alike.
On Evaluating Runtime Performance of Interactive Visualizations
V. Bruder, C. Müller, S. Frey, T. Ertl
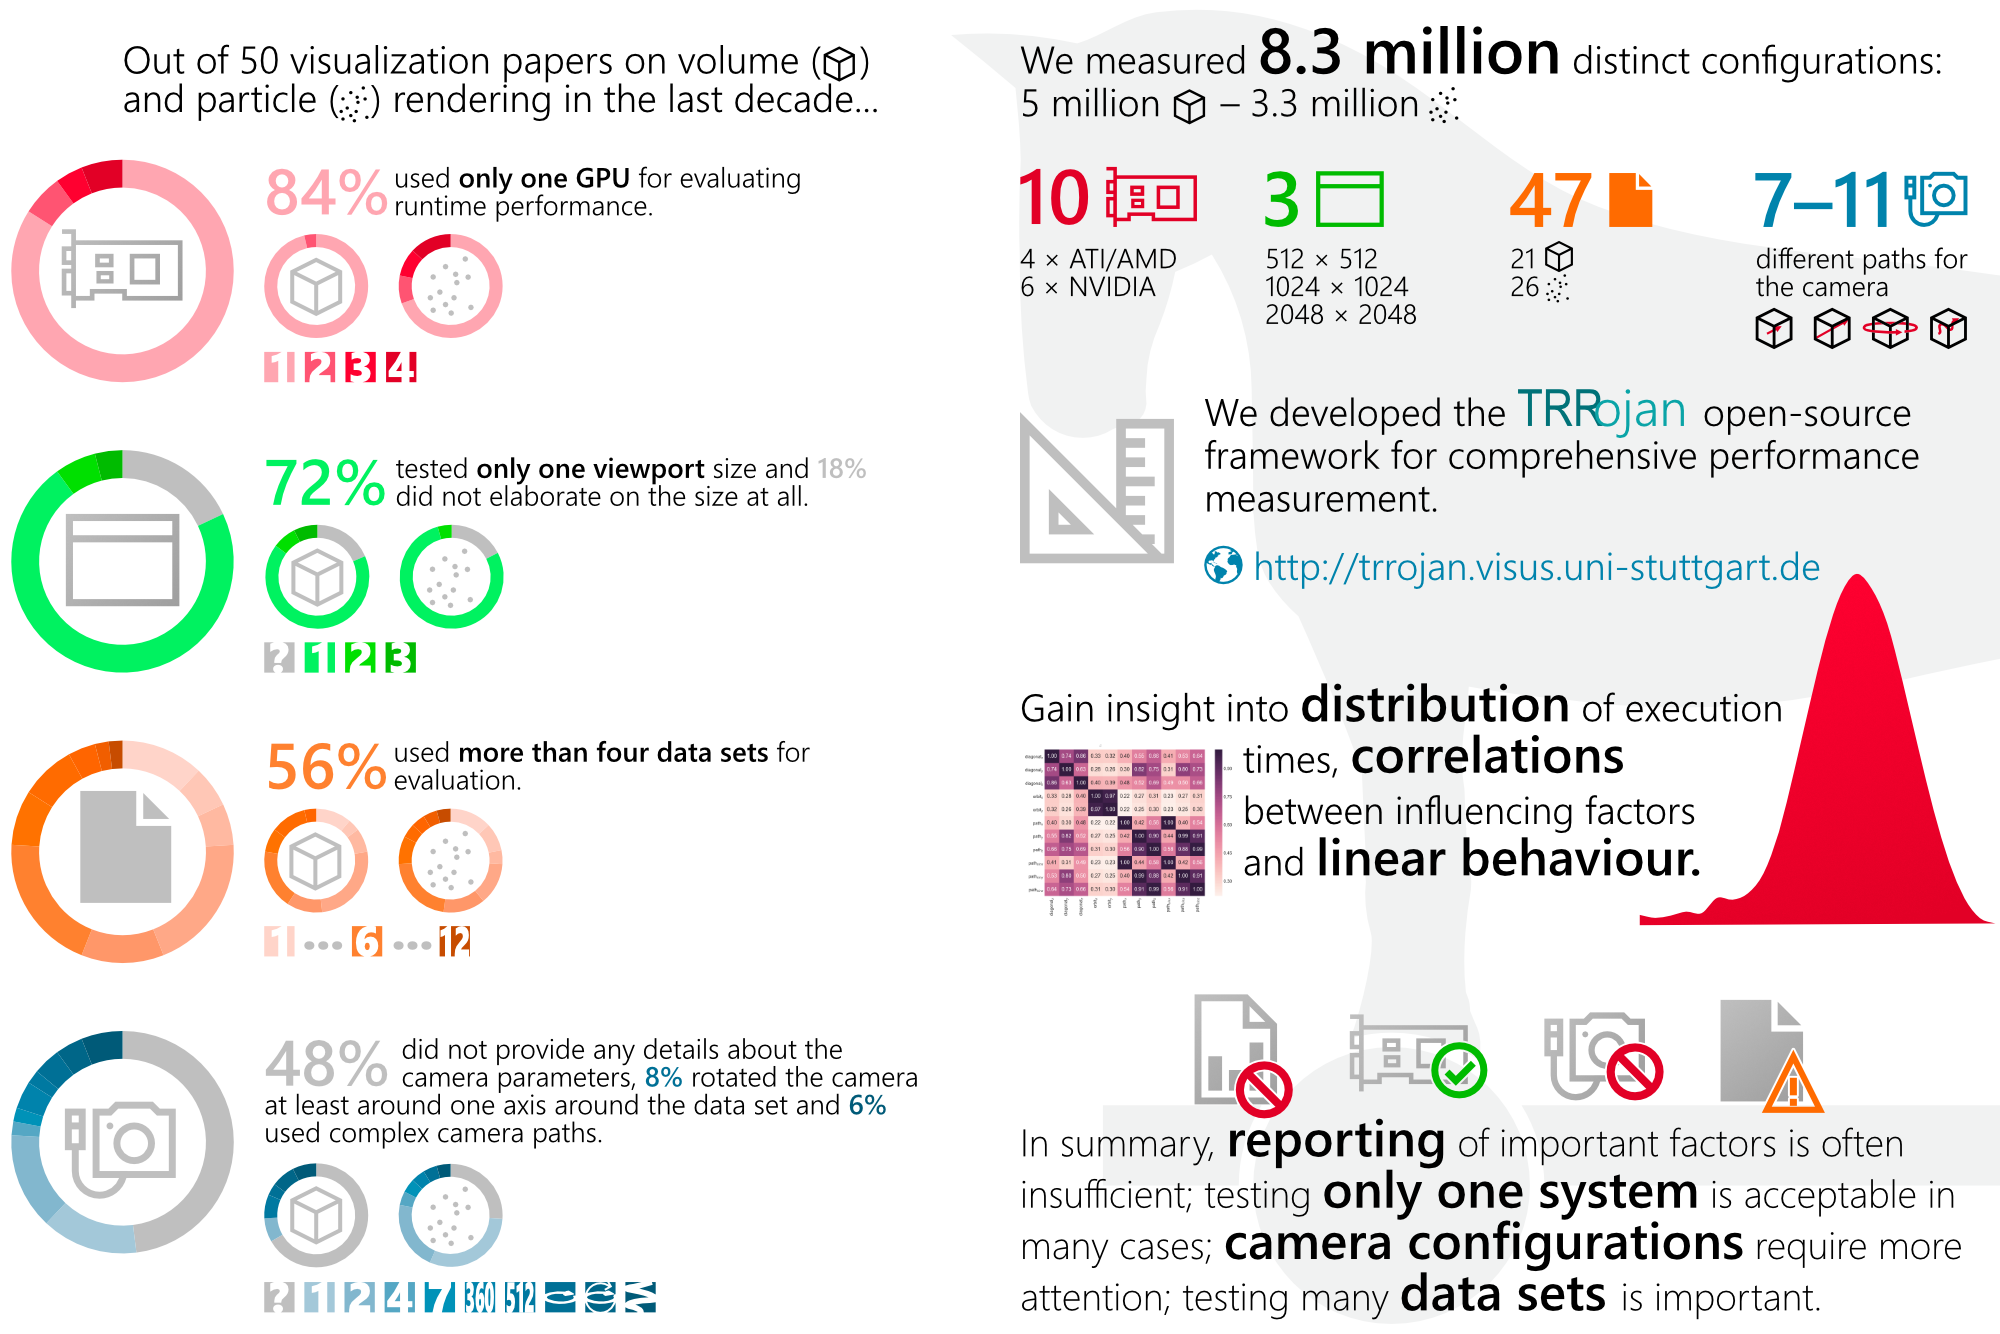
As our field matures, evaluation of visualization techniques has extended from reporting runtime performance to studying user behavior. Consequently, many methodologies and best practices for user studies have evolved. While maintaining interactivity continues to be crucial for the exploration of large data sets, no similar methodological foundation for evaluating runtime performance has been developed. Our analysis of 50 recent visualization papers on new or improved techniques for rendering volumes or particles indicates that only a very limited set of parameters like different data sets, camera paths, viewport sizes, and GPUs are investigated, which make comparison with other techniques or generalization to other parameter ranges at least questionable. To derive a deeper understanding of qualitative runtime behavior and quantitative parameter dependencies, we developed a framework for the most exhaustive performance evaluation of volume and particle visualization techniques that we are aware of, including millions of measurements on ten different GPUs. This paper reports on our insights from statistical analysis of this data, discussing independent and linear parameter behavior and non-obvious effects. We give recommendations for best practices when evaluating runtime performance of scientific visualization applications, which can serve as a starting point for more elaborate models of performance quantification.
Hybrid image processing approach for autonomous crack area detection and tracking using local digital image correlation results applied to single-fiber interfacial debonding
I. Tabiai, G. Tkachev, P. Diehl, S. Frey, T. Ertl, D. Therriault, M. Lévesque
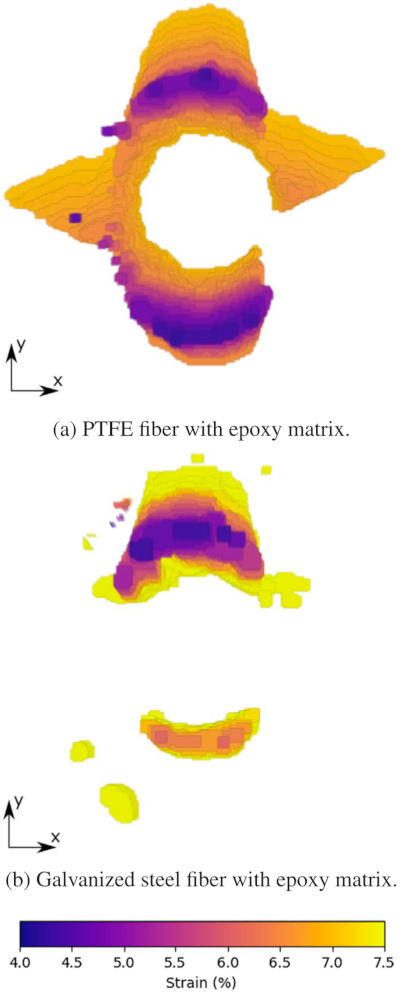
Local digital image correlation is a popular method for accurate full field displacement measurements. However, the technique struggles at autonomously tracking emerging and propagating cracks. We proposed a hybrid approach which utilizes image processing techniques in combination with local digital image correlation to autonomously monitor cracks in a mechanically loaded specimen. Our approach can extract and track crack surfaces and provide a volume-based visualization of the crack growth. This approach was applied to single-fiber composite experimental results with interfacial debonding from the literature. Results quantitatively show that strong interfacial fiber/matrix bonding leads to slower interfacial crack growth, delays interfacial crack growth in the matrix, requires higher loadings for crack growth and shows a specific crack path distinct from the one obtained for weak interfaces. The approach was also validated against a manual approach where a domain scientist extracts a crack using a polygon extraction tool. The method can be used on any local digital image correlation results involving damage observations.
2018
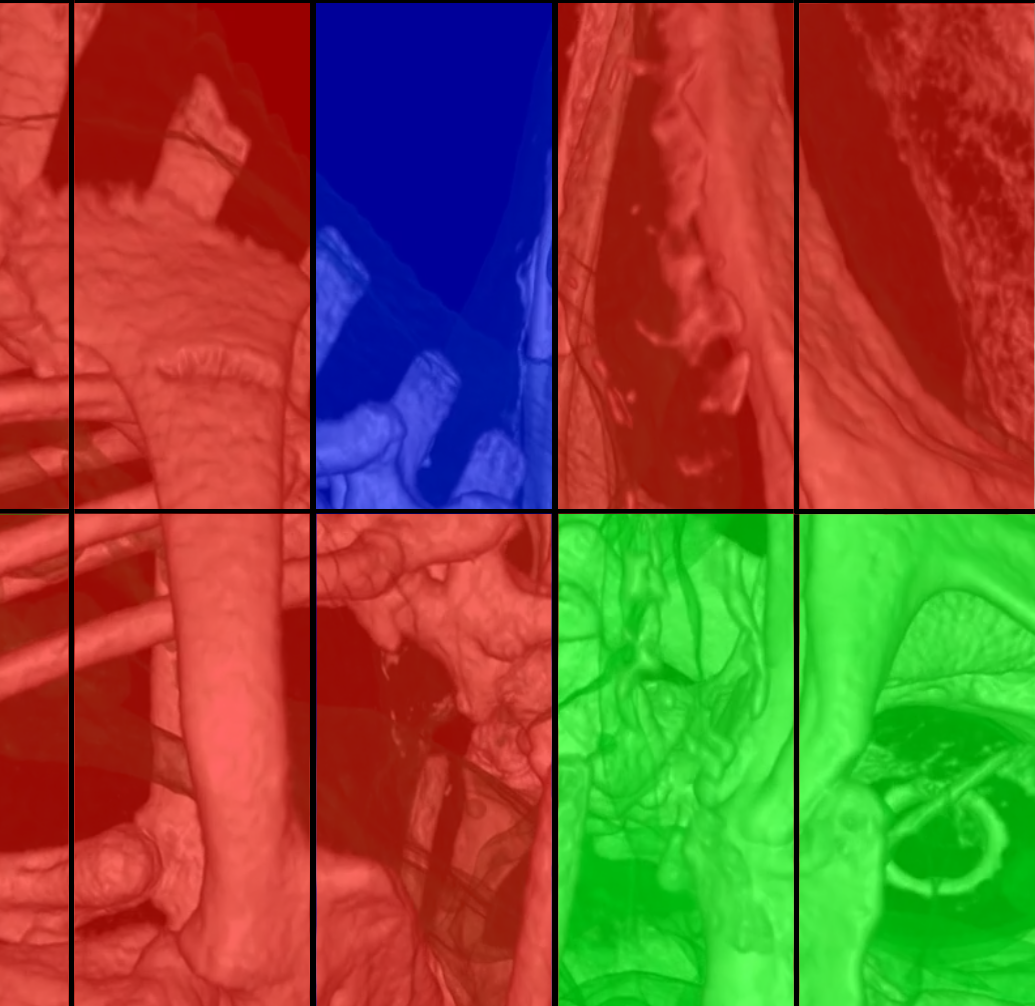
Adaptive Encoder Settings for Interactive Remote Visualisation on High-Resolution Displays
F. Frieß, M. Landwehr, V. Bruder, S. Frey, T. Ertl
We present an approach that dynamically adapts encoder settings for image tiles to yield the best possible quality for a given bandwidth. This reduces the overall size of the image while preserving details. Our application determines the encoding settings in two steps. In the first step, we predict the quality and size of the tiles for different encoding settings using a convolutional neural network. In the second step, we assign the optimal encoder setting to each tile, so that the overall size of the image is lower than a predetermined threshold. Commonly, for tiles that contain complicated structures, a high quality setting is used in order to prevent major information loss, while quality settings are lowered for others to keep the size below the threshold. We demonstrate that we can reduce the overall size of the image while preserving the details in areas of interest using the example of both particle and volume visualisation applications.

Visualization of Bubble Formation in Porous Media
H. Zhang, S. Frey, H. Steeb, D. Uribe, T. Ertl, W. Wang
We present a visualization approach for the analysis of CO2 bubble-induced attenuation in porous rock formations. As a basis for this, we introduce customized techniques to extract CO2 bubbles and their surrounding porous structure from X-ray computed tomography data (XCT) measurements. To understand how the structure of porous media influences the occurrence and the shape of formed bubbles, we automatically classify and relate them in terms of morphology and geometric features, and further directly support searching for promising porous structures. To allow for the meaningful direct visual comparison of bubbles and their structures, we propose a customized registration technique considering the bubble shape as well as its points of contact with the porous media surface. With our quantitative extraction of geometric bubble features, we further support the analysis as well as the creation of a physical model. We demonstrate that our approach was successfully used to answer several research questions in the domain, and discuss its high practical relevance to identify critical seismic characteristics of fluid-saturated rock that govern its capability to store CO2.

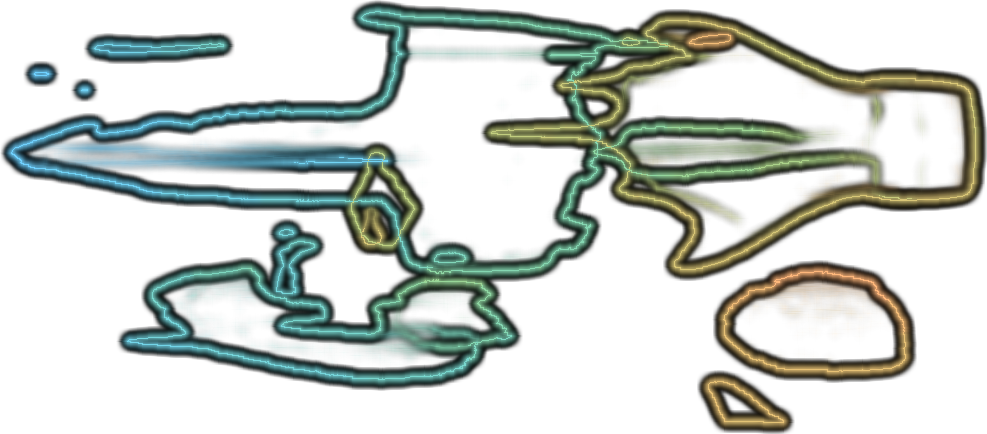
Spatio-Temporal Contours from Deep Volume Raycasting
S. Frey
We visualize contours for spatio-temporal processes to indicate where and when non-continuous changes occur or spatial bounds are encountered. All time steps are comprised densely in one visualization, with contours allowing to efficiently analyze processes in the data even in case of spatial or temporal overlap. Contours are determined on the basis of deep raycasting that collects samples across time and depth along each ray. For each sample along a ray, its closest neighbors from adjacent rays are identified, considering time, depth, and value in the process. Large distances are represented as contours in image space, using color to indicate temporal occurrence. This contour representation can easily be combined with volume rendering-based techniques, providing both full spatial detail for individual time steps and an outline of the whole time series in one view. Our view-dependent technique supports efficient progressive computation, and requires no prior assumptions regarding the shape or nature of processes in the data. We discuss and demonstrate the performance and utility of our approach via a variety of data sets, comparison and combination with an alternative technique, and feedback by a domain scientist.
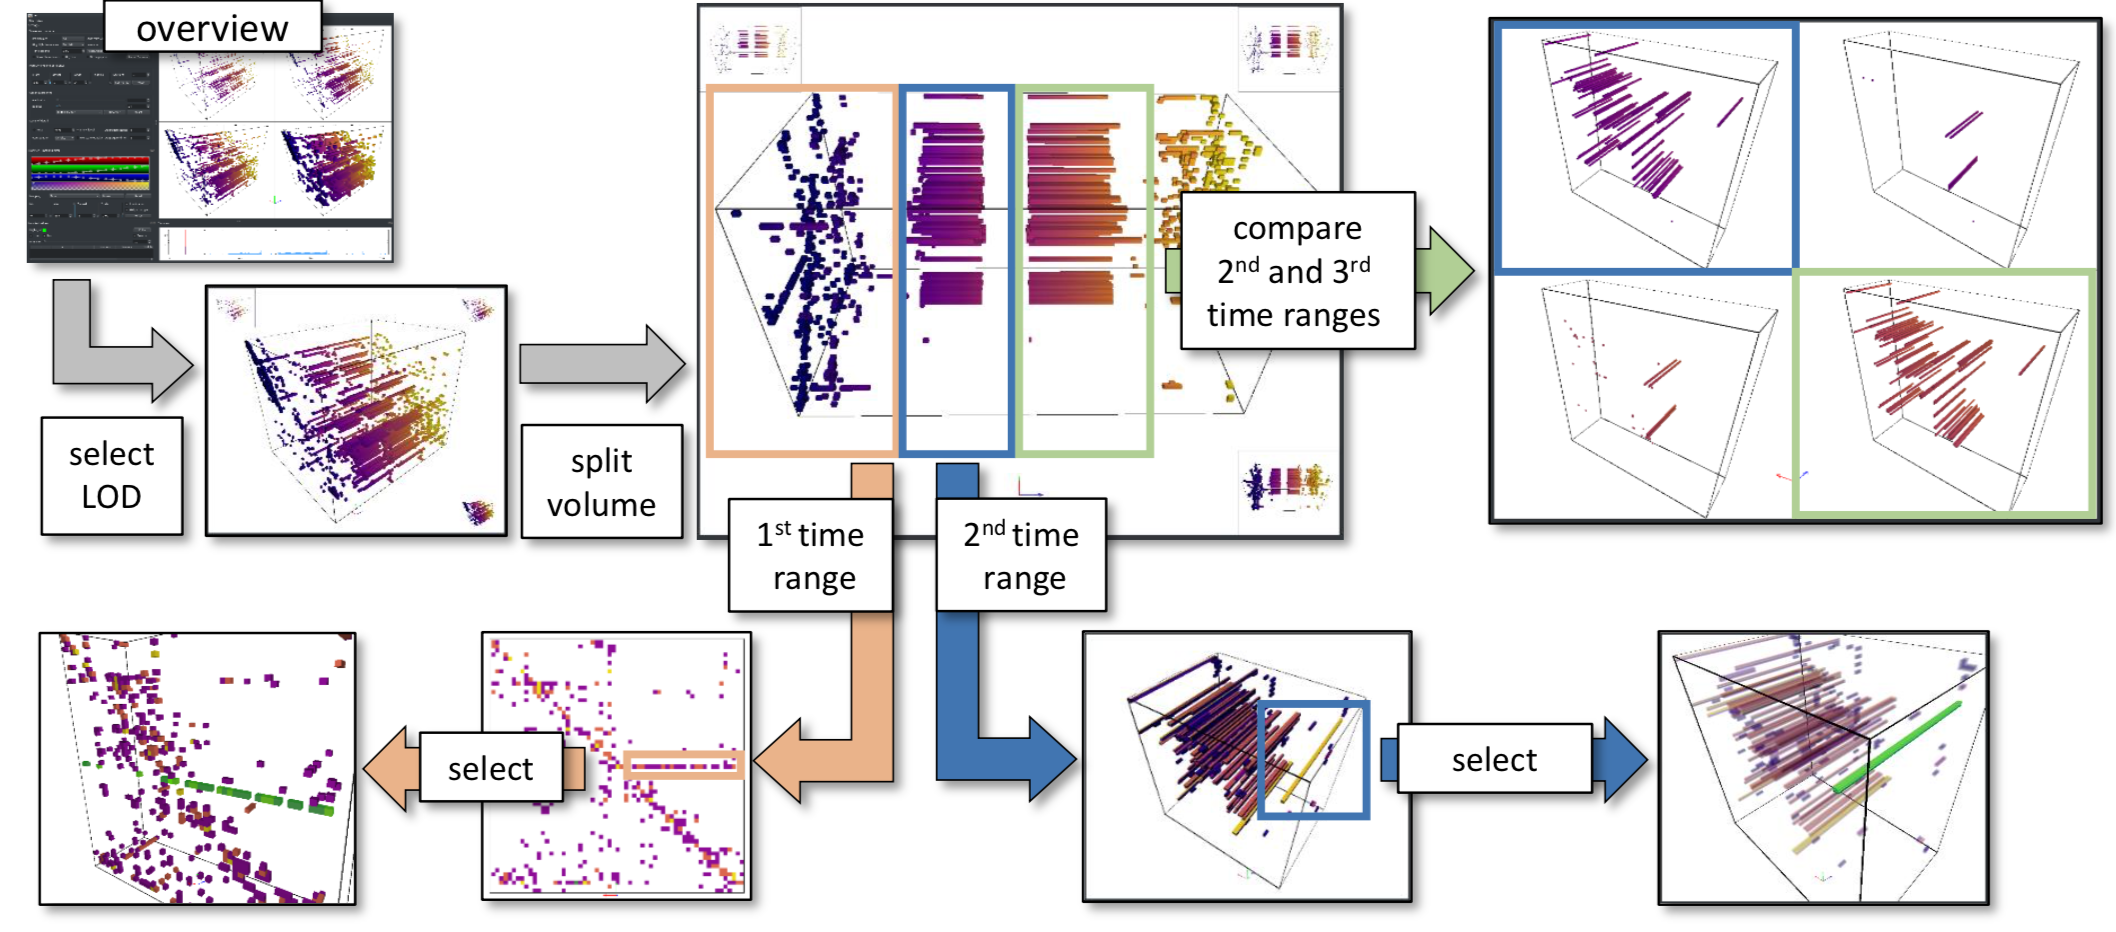
Volume-based Large Dynamic Graph Analytics
V. Bruder, M. Hlawatsch, S. Frey, M. Burch, D. Weiskopf, T. Ertl
IV 2018 | Best Paper
We present an approach for interactively analyzing large dynamic graphs consisting of several thousand time steps, with a particular focus on temporal aspects. We employ a static representation of the time-varying graph based on the concept of space-time cubes, i.e., we create a volumetric representation of the graph by stacking the adjacency matrices of each of its time steps. To achieve an efficient analysis of this complex data, we discuss three classes of analytics methods of particular importance in this context: data views, aggregation and filtering, and comparison. For these classes, we provide respective analysis techniques, with our GPU-based implementation enabling the interactive analysis of large graphs. We demonstrate the utility as well as the scalability of our approach by presenting application examples for analyzing different time-varying data sets.
2017
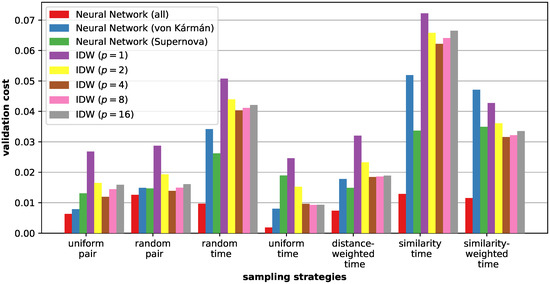
Sampling and Estimation of Pairwise Similarity in Spatio-Temporal Data Based on Neural Networks
S. Frey
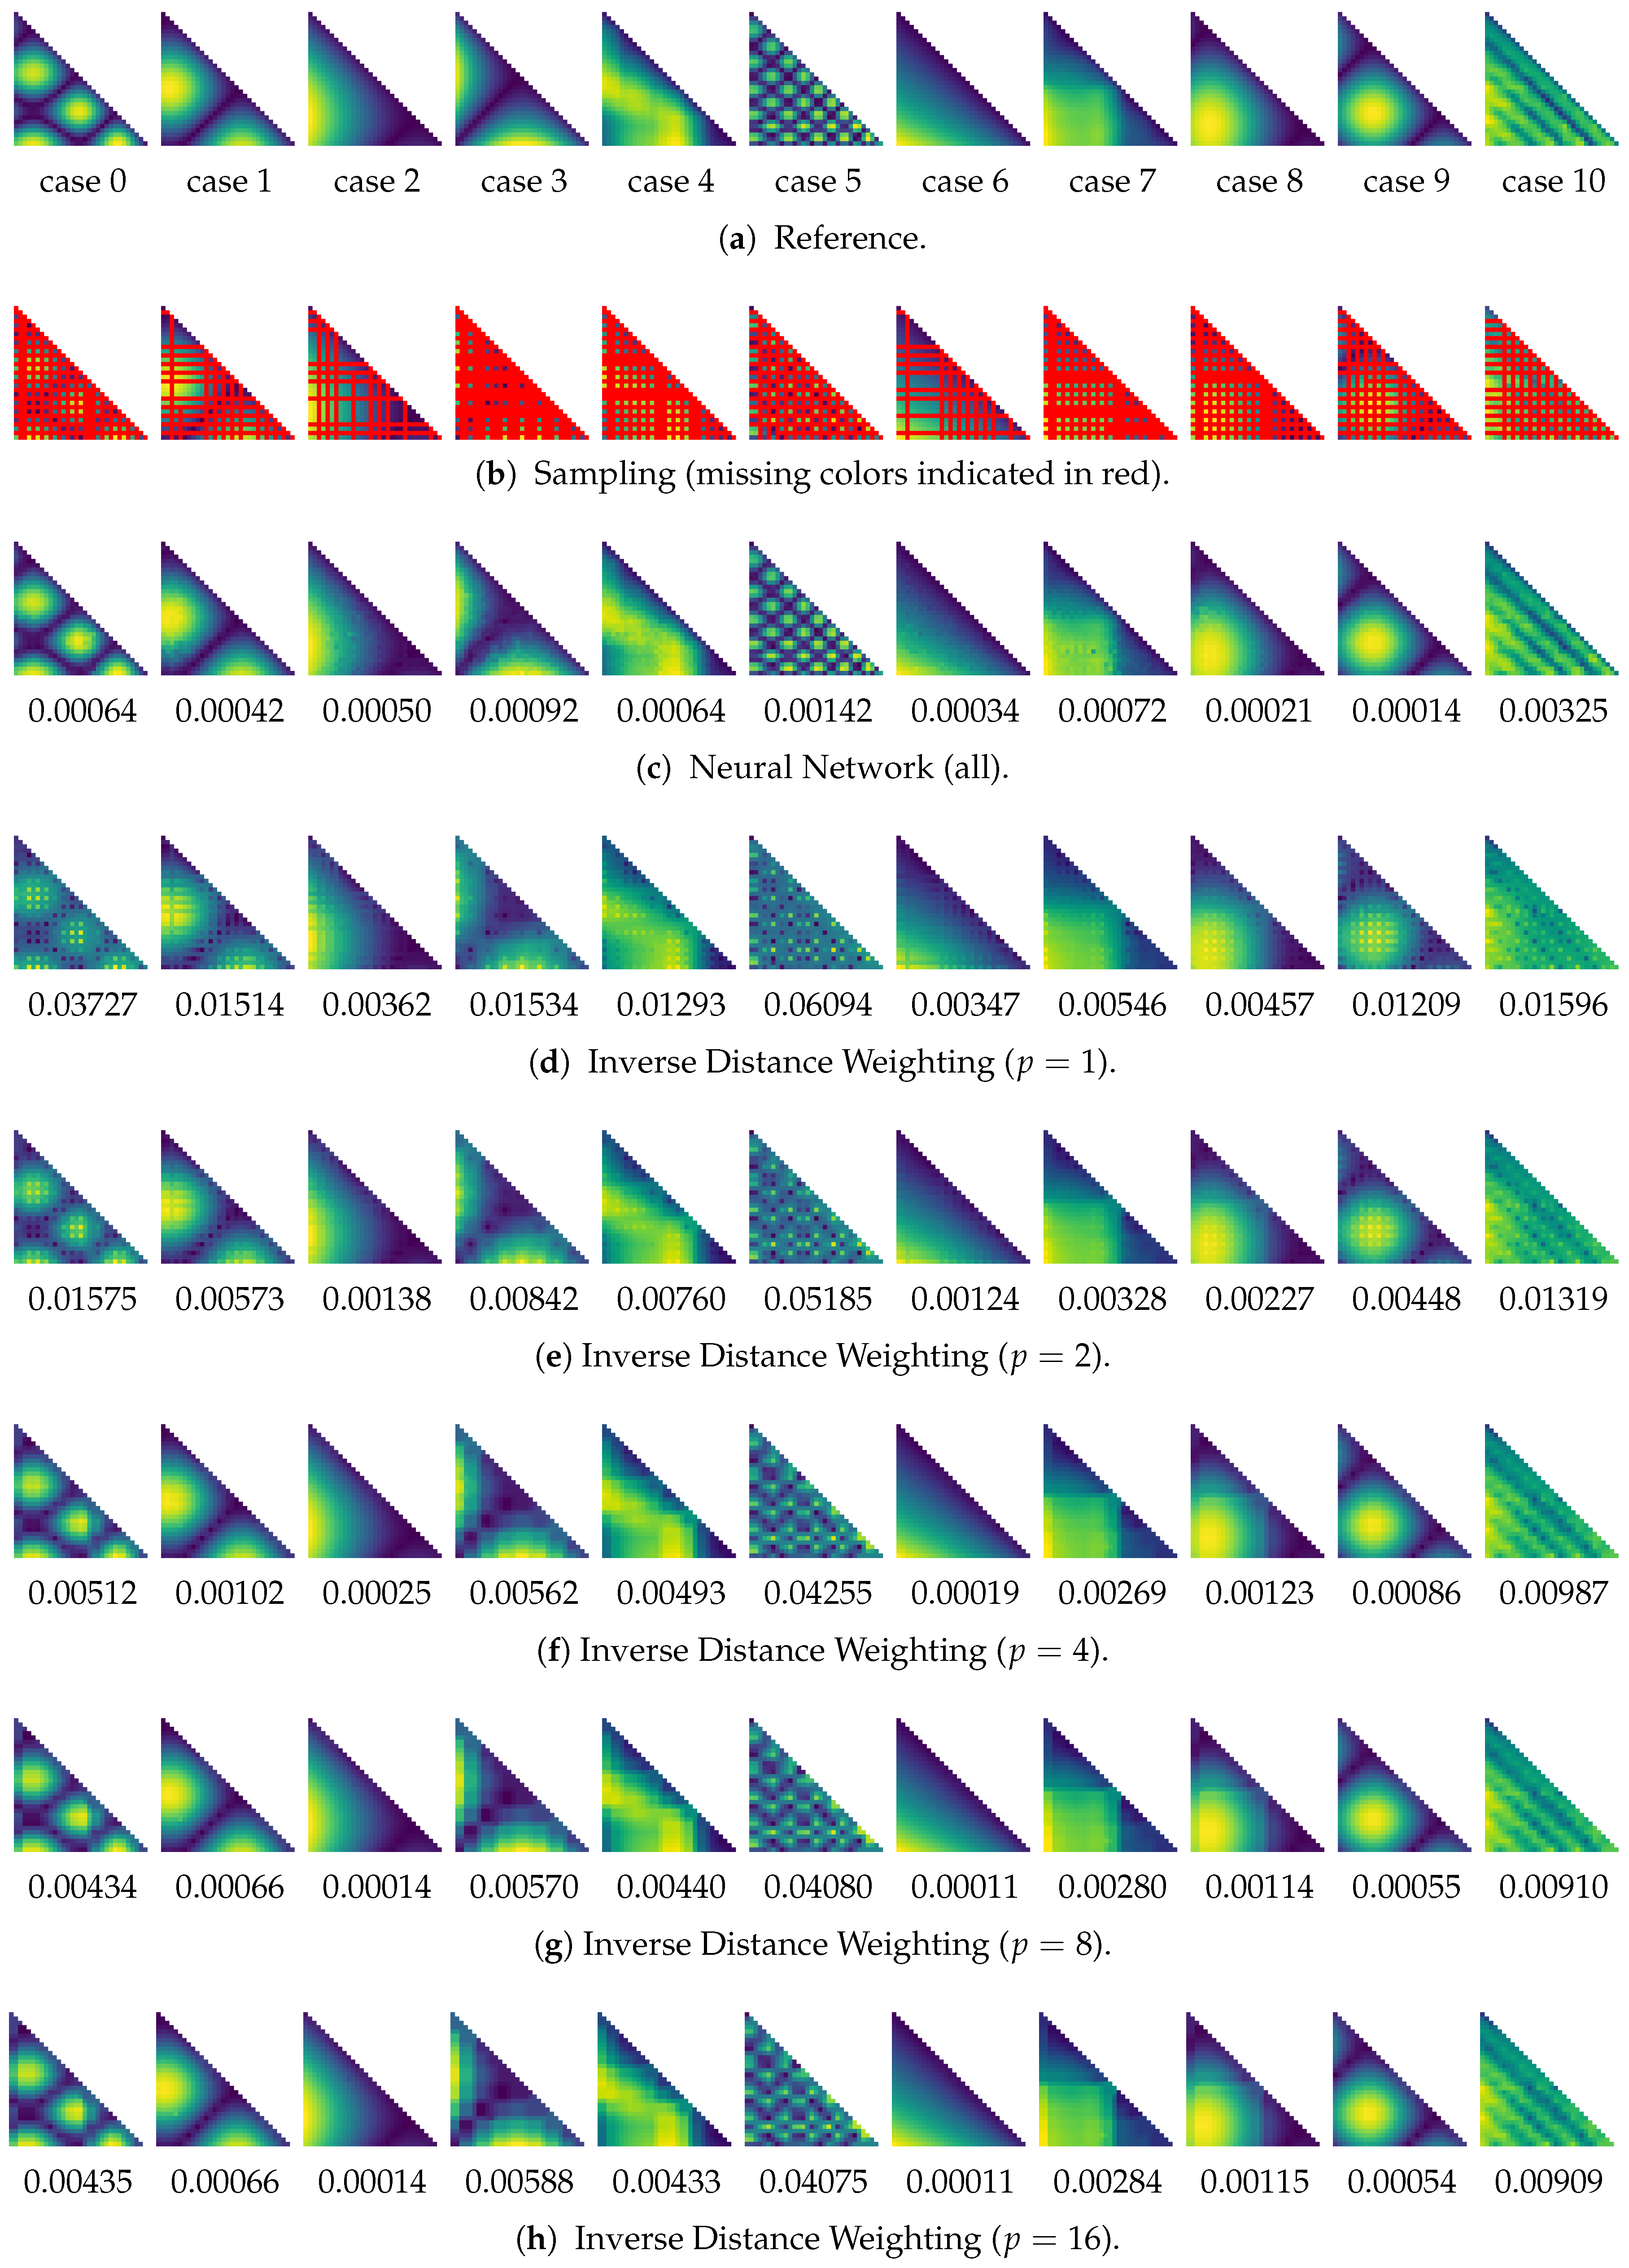
Increasingly fast computing systems for simulations and high-accuracy measurement techniques drive the generation of time-dependent volumetric data sets with high resolution in both time and space. To gain insights from this spatio-temporal data, the computation and direct visualization of pairwise distances between time steps not only supports interactive user exploration, but also drives automatic analysis techniques like the generation of a meaningful static overview visualization, the identification of rare events, or the visual analysis of recurrent processes. However, the computation of pairwise differences between all time steps is prohibitively expensive for large-scale data not only due to the significant cost of computing expressive distance between high-resolution spatial data, but in particular owing to the large number of distance computations (O(|T|2)), with |T| being the number of time steps). Addressing this issue, we present and evaluate different strategies for the progressive computation of similarity information in a time series, as well as an approach for estimating distance information that has not been determined so far. In particular, we investigate and analyze the utility of using neural networks for estimating pairwise distances. On this basis, our approach automatically determines the sampling strategy yielding the best result in combination with trained networks for estimation.
Prediction-Based Load Balancing and Resolution Tuning for Interactive Volume Raycasting
V. Bruder, S. Frey, T. Ertl
Visual Informatics
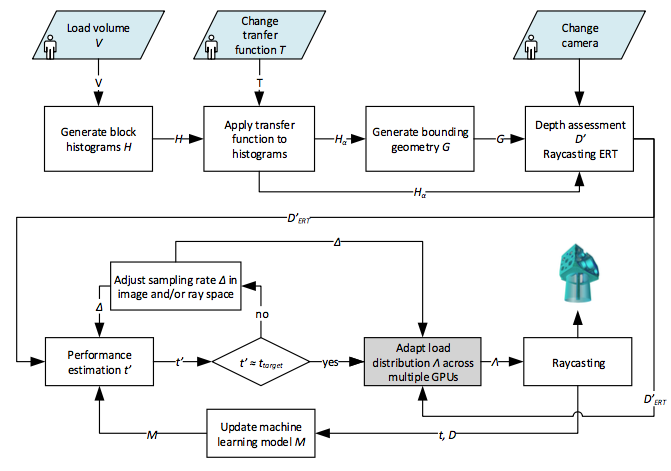
We present an integrated approach for real-time performance prediction of volume raycasting that we employ for load balancing and sampling resolution tuning. In volume rendering, the usage of acceleration techniques such as empty space skipping and early ray termination, among others, can cause significant variations in rendering performance when users adjust the camera configuration or transfer function. These variations in rendering times may result in unpleasant effects such as jerky motions or abruptly reduced responsiveness during interactive exploration. To avoid those effects, we propose an integrated approach to adapt rendering parameters according to performance needs. We assess performance-relevant data on-the-fly, for which we propose a novel technique to estimate the impact of early ray termination. On the basis of this data, we introduce a hybrid model, to achieve accurate predictions with minimal computational footprint. Our hybrid model incorporates aspects from analytical performance modeling and machine learning, with the goal to combine their respective strengths. We show the applicability of our prediction model for two different use cases: (1) to dynamically steer the sampling density in object and/or image space and (2) to dynamically distribute the workload among several different parallel computing devices. Our approach allows the renderer to reliably meet performance requirements such as a user-defined frame rate, even in the case of sudden large changes to the transfer function or camera orientation.
Power Efficiency of Volume Raycasting on Mobile Devices
M. Heinemann, V. Bruder, S. Frey, T. Ertl
EuroVis 2017 - Posters
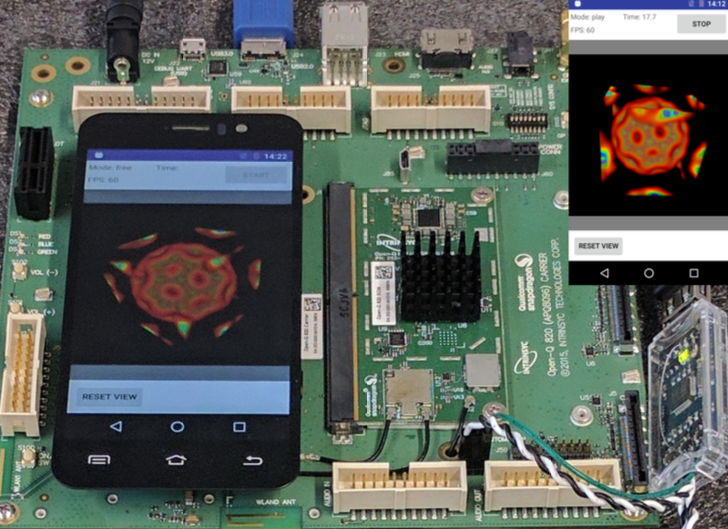
Power efficiency is one of the most important factors for the development of compute-intensive applications in the mobile domain. In this work, we evaluate and discuss the power consumption of a direct volume rendering app based on raycasting on a mobile system. For this, we investigate the influence of a broad set of algorithmic parameters, which are relevant for performance and rendering quality, on the energy usage of the system. Additionally, we compare an OpenCL implementation to a variant using OpenGL. By means of a variety of examples, we demonstrate that numerous factors can have a significant impact on power consumption. In particular, we also discuss the underlying reasons for the respective effects.
Visualization of fracture progression in peridynamics
M. Bußler, P. Diehl, D. Pflüger, S. Frey, F. Sadlo, T. Ertl, M. A. Schweitzer
Computers & Graphics
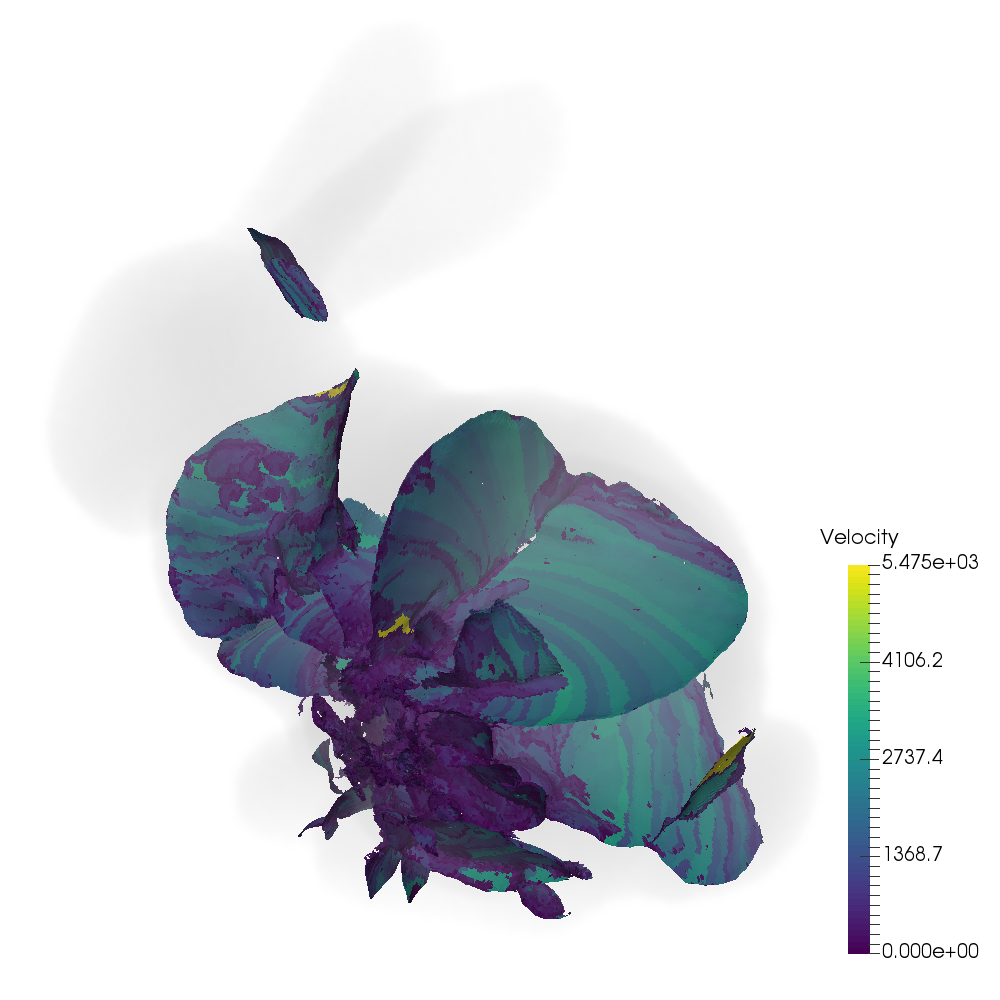
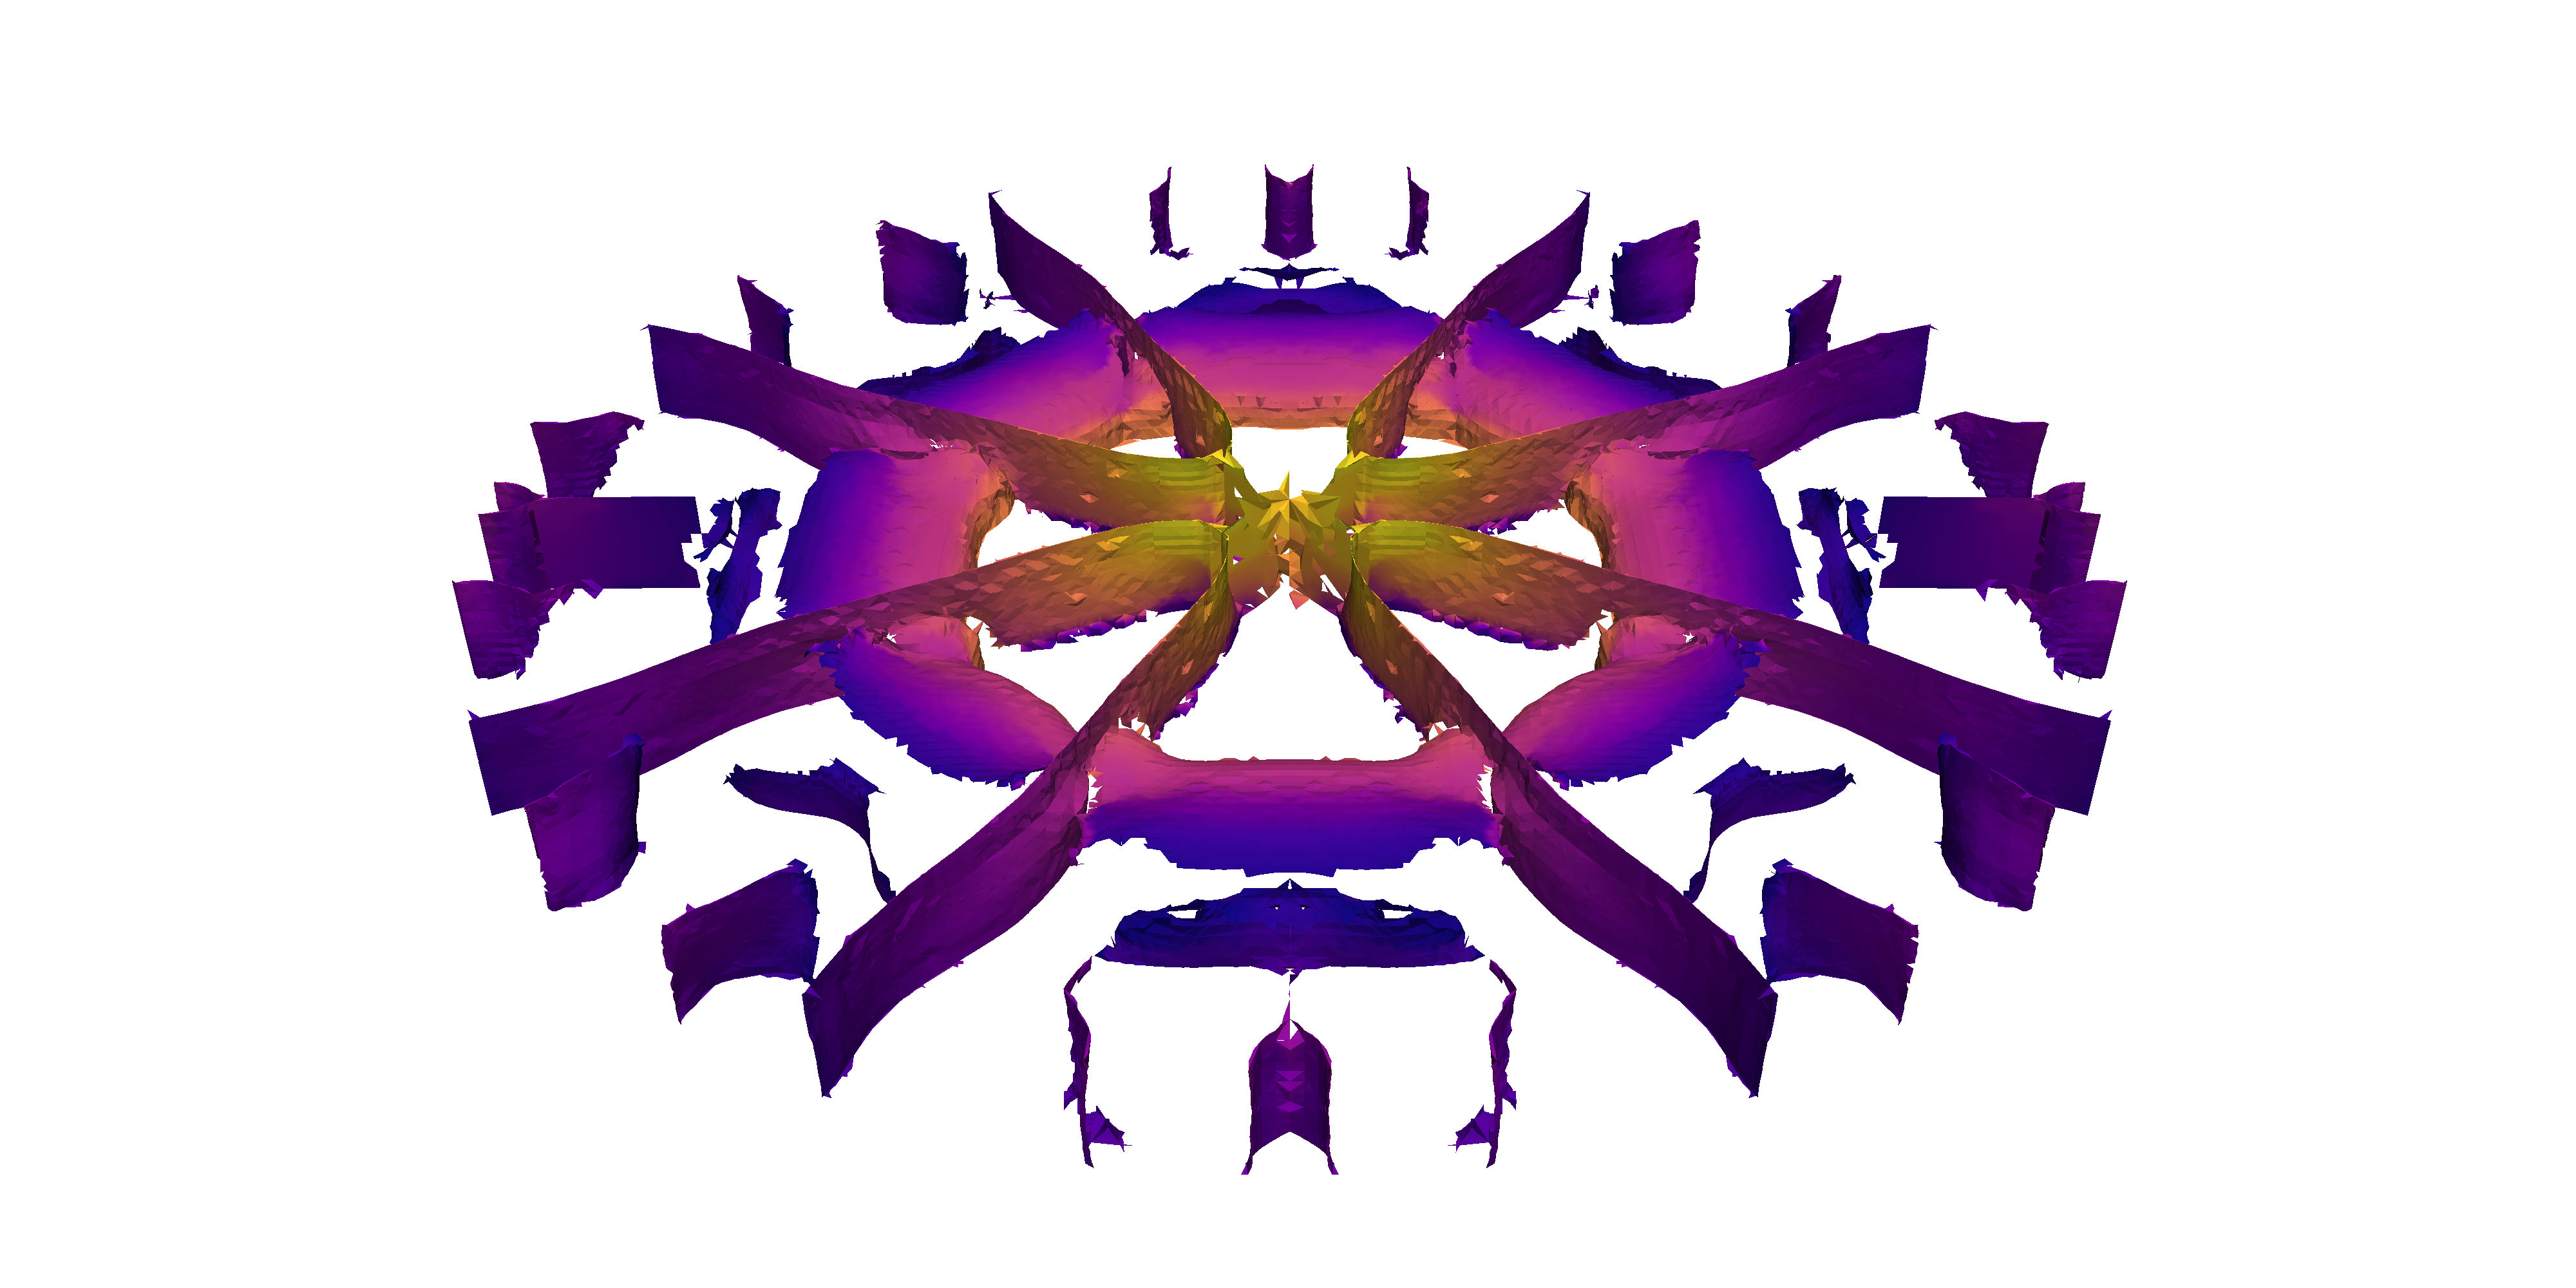
We present a novel approach for the visualization of fracture processes in peridynamics simulations. In peridynamics simulation, materials are represented by material points linked with bonds, providing complex fracture behavior. Our approach first extracts the cracks from each time step by means of height ridge extraction. To avoid deterioration of the structures, we propose an approach to extract ridges from these data without resampling. The extracted crack geometries are then combined into a spatiotemporal structure, with special focus on temporal coherence and robustness. We then show how this structure can be used for various visualization approaches to reveal fracture dynamics, with a focus on physical mechanisms. We evaluate our approach and demonstrate its utility by means of different data sets.

Prediction of Distributed Volume Visualization Performance to Support Render Hardware Acquisition
G.Tkachev, S.Frey, C.Müller, V.Bruder, T.Ertl
Eurographics Symposium on Parallel Graphics and Visualization (EGPGV) 2017
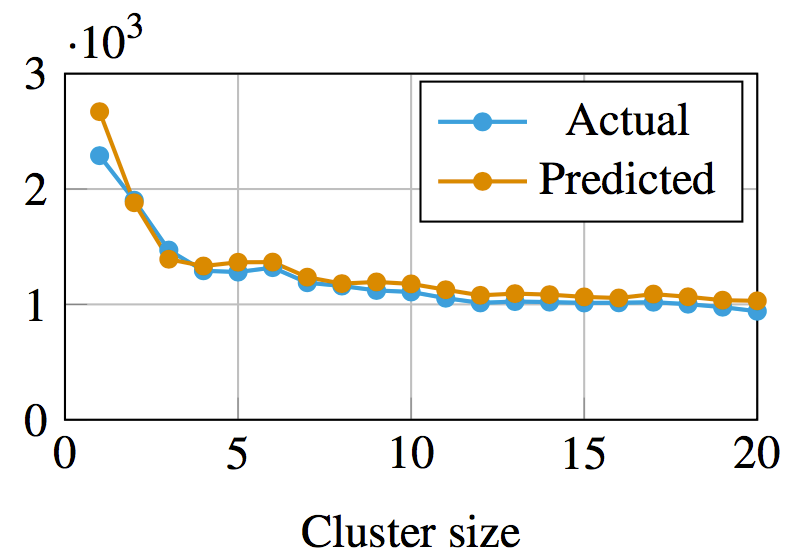
We present our data-driven, neural network-based approach to predicting the performance of a distributed GPU volume renderer for supporting cluster equipment acquisition. On the basis of timing measurements from a single cluster as well as from individual GPUs, we are able to predict the performance gain of upgrading an existing cluster with additional or faster GPUs, or even purchasing of a new cluster with a comparable network configuration. To achieve this, we employ neural networks to capture complex performance characteristics. However, merely relying on them for the prediction would require the collection of training data on multiple clusters with different hardware, which is impractical in most cases. Therefore, we propose a two-level approach to prediction, distinguishing between node and cluster level. On the node level, we generate performance histograms on individual nodes to capture local rendering performance. These performance histograms are then used to emulate the performance of different rendering hardware for cluster-level measurement runs. Crucially, this variety allows the neural network to capture the compositing performance of a cluster separately from the rendering performance on individual nodes. Therefore, we just need a performance histogram of the GPU of interest to generate a prediction. We demonstrate the utility of our approach using different cluster configurations as well as a range of image and volume resolutions.
Fast Flow-based Distance Quantification and Interpolation for High-Resolution Density Distributions
S. Frey, T. Ertl
EuroGraphics 2017, Short Paper
(also presented at NVIDIA GTC 2017)
(also presented at NVIDIA GTC 2017)
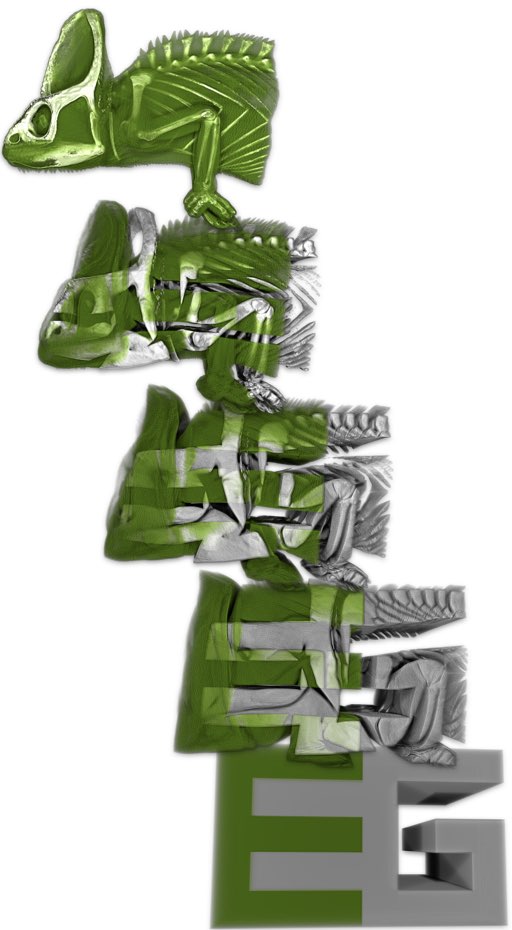
We present a GPU-targeted algorithm for the efficient direct computation of distances and interpolates between high-resolution density distributions without requiring any kind of intermediate representation like features. It is based on a previously published multi-core approach, and substantially improves its performance already on the same CPU hardware due to algorithmic improvements. As we explicitly target a manycore-friendly algorithm design, we further achieve significant speedups by running on a GPU. This paper quickly reviews the previous approach, and explicitly discusses the analysis of algorithmic characteristics as well as hardware architectural considerations on which our redesign was based. We demonstrate the performance and results of our technique by means of several transitions between volume data sets.


Spline-based Decomposition of Streamed Particle Trajectories for Efficient Transfer and Analysis Conversion
K. Scharnowski, S. Frey, B. Raffin, T. Ertl
EuroVis 2017, Short Paper
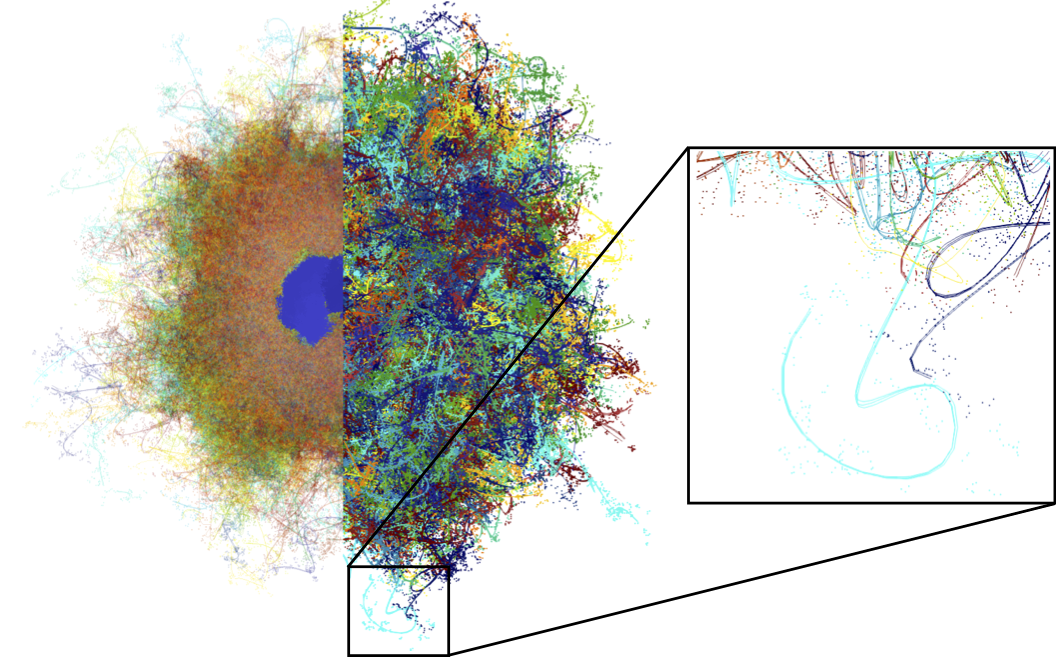
We introduce an approach for distributed processing and efficient storage of noisy particle trajectories, and present visual analysis techniques that directly operate on the generated representation. For efficient storage, we decompose individual trajectories into a smooth representation and a high frequency part. Our smooth representation is generated by fitting Hermite Splines to a series of time windows, adhering to a certain error bound. This directly supports scenarios involving in situ and streaming data processing. We show how the individually fitted splines can afterwards be combined into one spline posessing the same mathematical properties, i.e. C1 continuity as well as our error bound. The fitted splines are typically significantly smaller than the original data, and can therefore be used, e.g., for an online monitoring and analysis of distributed particle simulations. The high frequency part can be used to reconstruct the original data, or could also be discarded in scenarios with limited storage capabilities. Finally, we demonstrate the utility of our smooth representation for different analysis queries using real world data.
Transportation-based Visualization of Energy Conversion
O. Fernandes, S. Frey, T. Ertl
IVAPP 2017
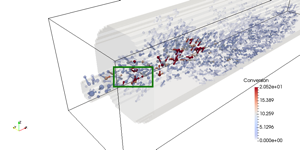
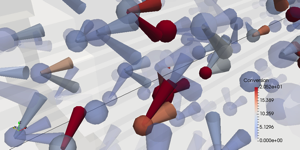
We present a novel technique to visualize the transport of and conversion between internal and kinetic energy in compressible flow data. While the distribution of energy can be directly derived from flow state variables (e.g., velocity, pressure and temperature) for each time step individually, there is no information regarding the involved transportation and conversion processes. To visualize these, we model the energy transportation problem as a graph that can be solved by a minimum cost flow algorithm, inherently respecting energy conservation. In doing this, we explicitly consider various simulation parameters like boundary conditions and energy transport mechanisms. Based on the resulting flux, we then derive a local measure for the conversion between energy forms using the distribution of internal and kinetic energy. To examine this data, we employ different visual mapping techniques that are specifically targeted towards different research questions. In particular, we introduce glyphs for visualizing local energy transport, which we place adaptively based on conversion rates to mitigate issues due to clutter and occlusion.
Progressive Direct Volume-to-Volume Transformation
S. Frey, T. Ertl
TVCG (VIS 2016 paper)
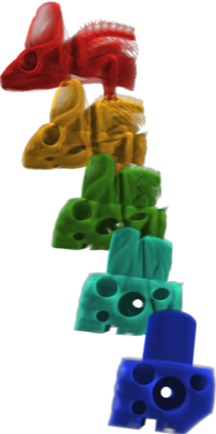
We present a novel technique to generate transformations between arbitrary volumes, providing both expressive distances and smooth interpolates. In contrast to conventional morphing or warping approaches, our technique requires no user guidance, intermediate representations (like extracted features), or blending, and imposes no restrictions regarding shape or structure. Our technique operates directly on the volumetric data representation, and while linear programming approaches could solve the underlying problem optimally, their polynomial complexity makes them infeasible for high-resolution volumes. We therefore propose a progressive refinement approach designed for parallel execution that is able to quickly deliver approximate results that are iteratively improved toward the optimum. On this basis, we further present a new approach for the streaming selection of time steps in temporal data that allows for the reconstruction of the full sequence with a user-specified error bound.
2016

Generative Data Models for Validation and Evaluation of Visualization Techniques
C. Schulz, Christoph and A. Nocaj, M. El-Assady, S. Frey, M. Hlawatsch, M. Hund, G. Karch, R. Netzel, C. Schätzle, M. Butt, D. Keim, T. Ertl, U. Brandes, D. Weiskopf
BELIV '16: Beyond Time And Errors: Novel Evaluation Methods For Visualization
We argue that there is a need for substantially more research on the use of generative data models in the validation and evaluation of visualization techniques. For example, user studies will require the display of representative and uncon- founded visual stimuli, while algorithms will need functional coverage and assessable benchmarks. However, data is often collected in a semi-automatic fashion or entirely hand-picked, which obscures the view of generality, impairs availability, and potentially violates privacy. There are some sub-domains of visualization that use synthetic data in the sense of genera- tive data models, whereas others work with real-world-based data sets and simulations. Depending on the visualization domain, many generative data models are “side projects” as part of an ad-hoc validation of a techniques paper and thus neither reusable nor general-purpose. We review existing work on popular data collections and generative data models in visualization to discuss the opportunities and consequences for technique validation, evaluation, and experiment design. We distill handling and future directions, and discuss how we can engineer generative data models and how visualization research could benefit from more and better use of generative data models.
Flow-based Temporal Selection for Interactive Volume Visualization
S. Frey, T. Ertl
Computer Graphics Forum (presented at Eurographics 2017)
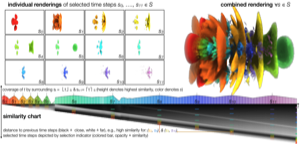
We present an approach to adaptively select time steps from time-dependent volume data sets for an integrated and comprehensive visualization. This reduced set of time steps not only saves cost, but also allows to show both the spatial structure and temporal development in one combined rendering. Our selection optimizes the coverage of the complete data on the basis of a minimum-cost flow-based technique to determine meaningful distances between time steps. As both optimal solutions of the involved transport and selection problem are prohibitively expensive, we present new approaches that are significantly faster with only minor deviations. We further propose an adaptive scheme for the progressive incorporation of new time steps. An interactive volume raycaster produces an integrated rendering of the selected time steps, and their computed differences are visualized in a dedicated chart to provide additional temporal similarity information.
Interpolation-Based Extraction of Representative Isosurfaces
O. Fernandes, S. Frey, T. Ertl
ISVC 2016
We propose a novel technique for the automatic, similarity- based selection of representative surfaces. While our technique can be applied to any set of manifolds, we particularly focus on isosurfaces from volume data. We select representatives from sets of surfaces stemming from varying isovalues or time-dependent data. For selection, our approach interpolates between surfaces using a minimum cost flow solver, and determines whether the interpolate adequately represents the actual surface in-between. For this, we employ the Hausdorff distance as an intuitive measure of the similarity of two components. In contrast to popular contour tree-based approaches which are limited to changes in topology, our approach also accounts for geometric deviations. For interactive visualization, we employ a combination of surface renderings and a graph view that depicts the selected surfaces and their relation.
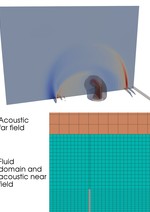
Partitioned Fluid-Structure-Acoustics Interaction on Distributed Data
Blom, David S.; Ertl, Thomas; Fernandes, Oliver; Frey, Steffen; Klimach, Harald; Krupp, Verena; Mehl, Miriam; Roller, Sabine; Sternel, Dörte C.; Uekermann, Benjamin; Winter, Tilo; Van Zuijlen, Alexander H.
Software for Exascale Computing - SPPEXA 2013-2015
We present a coupled simulation approach for fluid-structure-acoustic interactions as an example for strongly surface coupled multi-physics problems. In addition to the multi-physics character, FSAI feature multi-scale properties as a further challenge. In our partitioned approach, the problem is split into spatially separated subdomains interacting via coupling surfaces. Within each subdomain, scalable, single physics solvers are used to solve the respective equation systems. We run this simulation with different solvers demonstrating the performance of various solvers and the flexibility of the partitioned approach with the coupling tool preCICE. An efficient and scalable in-situ visualization reducing the amount of data in place at the simulation processors before sending them over the network or to a file system completes the simulation environment.

Real-Time Performance Prediction and Tuning for Interactive Volume Raycasting
V. Bruder, S. Frey, T. Ertl
SIGGRAPH ASIA 2016 Symposium on Visualization
We present an integrated approach for the real-time performance prediction and tuning of volume raycasting. The usage of empty space skipping and early ray termination, among others, can induce significant variations in performance when camera configuration and transfer functions are adjusted.
For interactive exploration, this can result in various unpleasant effects like abruptly reduced responsiveness or jerky motions. To overcome those effects, we propose an integrated approach to accelerate the rendering and assess performance-relevant data on-the-fly, including a new technique to estimate the impact of early ray termination. On this basis, we introduce a hybrid model, to achieve accurate predictions with only minimal computational footprint. Our hybrid model incorporates both aspects from analytical performance modeling and machine learning, with the goal to combine their respective strengths. Using our model, we dynamically steer the sampling density along rays with our automatic tuning technique.
For interactive exploration, this can result in various unpleasant effects like abruptly reduced responsiveness or jerky motions. To overcome those effects, we propose an integrated approach to accelerate the rendering and assess performance-relevant data on-the-fly, including a new technique to estimate the impact of early ray termination. On this basis, we introduce a hybrid model, to achieve accurate predictions with only minimal computational footprint. Our hybrid model incorporates both aspects from analytical performance modeling and machine learning, with the goal to combine their respective strengths. Using our model, we dynamically steer the sampling density along rays with our automatic tuning technique.
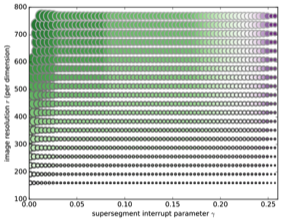

Auto-Tuning Intermediate Representations for In Situ Visualization
S. Frey, T. Ertl
2016 New York Scientific Data Summit (NYSDS): Data-Driven Discovery
To optimize the generation of intermediate representations for hybrid in situ visualization, we present our approach to (1) analyze and quantify the impact of input parameters, and (2) to auto-tune them on this basis under the consideration of different constraints. We demonstrate its application and evaluate respective results at the example of Volumetric Depth Images (VDIs), a view-dependent representation for volumetric data. VDIs can quickly and flexibly be generated via a modified volume raycasting procedure that partitions and partially composits samples along view rays. In particular, we study the impact of respective input parameters on this process w.r.t. the involved quality-space trade-off. We quantify rendering quality via image quality metrics and space requirements via the compressed size of the intermediate representation. On this basis, we then automatically determine the parameter settings that yield the best quality under different constraints. We demonstrate the utility of our approach by means of a variety of different data sets, and show that we optimize the achieved results without having to rely on tedious and time-consuming manual tweaking.
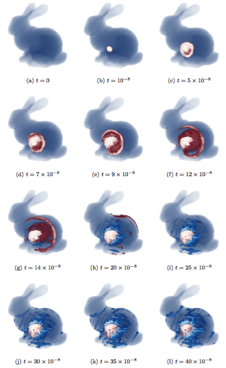
Extraction of Fragments and Waves After Impact Damage in Particle-Based Simulations
P. Diehl, M. Bußler, D. Pflüger, S. Frey, T. Ertl, F. Sadlo, M. A. Schweitzer
Meshfree Methods for Partial Differential Equations VIII, Springer International Publishing
The analysis of simulation results with complex geometries and the verification against experimental data is essential for impact damage and wave propagation. We present two visualization techniques for post-processing particle-based simulation data and highlight new aspects for the quantitative comparison with experimental data. Peridynamics, a non-local generalization of continuum mechanics, is considered as the reference particle method. The first approach is an extended connected component algorithm to extract the fragment size and the corresponding histograms. The distribution of the fragment size is experimental verifiable with these experiments. The second approach focus on the visualization of the stress after an impact in a complex geometry. Here the particle-based data is re-sampled and rendered with standard volume rendering techniques to address the interference pat- tern of the stress wave after the reflection at the boundary.
2015
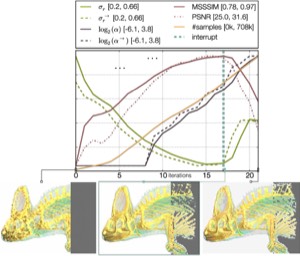
Balanced Sampling and Compression for Remote Visualization
S. Frey, F. Sadlo, and T. Ertl
SIGGRAPH Asia Symposium on Visualization in High Performance Computing, Kobe, Japan, 2015.
We present a novel approach for handling sampling and compression in remote visualization in an integrative fashion. As adaptive sampling and compression share the same underlying concepts and criteria, the times spent for visualization and transfer can be balanced directly to optimize the image quality that can be achieved within a prescribed time window. Our dynamic adjustments regarding adaptive sampling, compression, and balancing, employ regression analysis-based error estimation which is carried out individually for each image block of a visualization frame. Our approach is tuned for high parallel efficiency in GPU-based remote visualization. We demonstrate its utility within a prototypical remote volume visualization pipeline by means of different datasets and configurations.
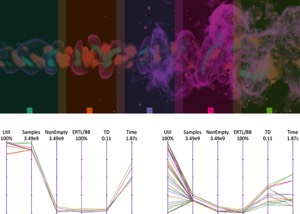
Exploratory Performance Analysis and Tuning of Parallel Interactive Volume Visualization on Large Displays
A. Panagiotidis, S. Frey, and T. Ertl
EuroVis 2015, Short Paper, Cagliari, Sardinia, Italy, 2015.
In this paper, we present an integrated approach for exploratory performance analysis and parameter optimization of interactive distributed volume visualization for large displays. We collect performance metrics of interest on-the-fly directly from both the GPU and our volume ray casting implementation and visualize them simultaneously. This allows users to explore the data set together with the corresponding metrics to jointly investigate both the visual and the performance impact of different parameter settings, like camera position, sampling density, or acceleration technique.
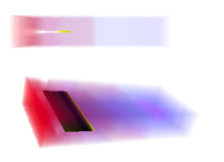
On In-Situ Visualization for Strongly Coupled Partitioned Fluid-Structure Interaction
O. Fernandes, D.. Blom, S. Frey, A. V. Zuijlen, H. Bijl, and T. Ertl
We present an integrated in-situ visualization approach for partitioned multi-physics simulation of fluid-structure interaction. The simulation itself is treated as a black box and only the information at the fluid-structure interface is considered, and communicated between the fluid and solid solvers with a separate coupling tool.
2014
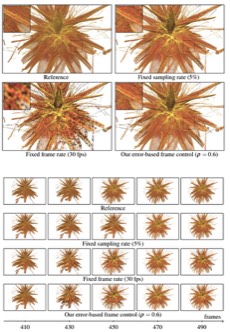
Interactive Progressive Visualization with Space-Time Error Control
S. Frey, F. Sadlo, K.-L. Ma, and T. Ertl
IEEE Transactions on Visualization and Computer Graphics (Proceedings IEEE SciVis 2014), Paris, France, 2014.
Static settings with respect to a certain image quality or frame rate are inherently incapable of delivering both high frame rate for rapid changes and high image quality for detailed investigation. Our technique flexibly adapts by steering the visualization process in three major degrees of freedom: when to terminate the
refinement of a frame in the background and start a new one, when to display a frame currently computed, and how much resources to consume. We base these decisions on the correlation of the errors due to insufficient sampling and response delay, which we estimate separately using fast yet expressive heuristics.
refinement of a frame in the background and start a new one, when to display a frame currently computed, and how much resources to consume. We base these decisions on the correlation of the errors due to insufficient sampling and response delay, which we estimate separately using fast yet expressive heuristics.
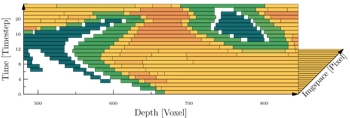
Space-Time Volumetric Depth Images for In-Situ Visualization
O. Fernandes, S. Frey, F. Sadlo, and T. Ertl
IEEE Symposium on Large Data Analysis and Visualization, Paris, France, 2014.
Volumetric depth images (VDI) are a view-dependent representation that combines the high quality of images with the explorability of 3D fields. By compressing the scalar data along view rays into sets of coherent supersegments, VDIs provide an efficient representation that supports a-posteriori changes of camera parameters. In this paper, we introduce space-time VDIs that achieve the data reduction that is required for efficient in-situ
visualization, while still maintaining spatiotemporal flexibility.
visualization, while still maintaining spatiotemporal flexibility.
2013
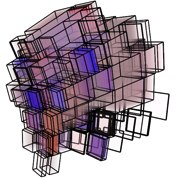
Explorable Volumetric Depth Images from Raycasting
S. Frey, F. Sadlo, and T. Ertl
SIBGRAPI 2013 - Conference on Graphics, Patterns, and Images, Arequipa, Peru, 2013.
View-dependent image-based rendering techniques have become increasingly popular as they combine the high quality of images with the explorability of interactive techniques. However, in the context of volume rendering, previous approaches suffer from various shortcomings, including the limitation to surfaces, expensive generation, and insufficient occlusion and motion parallax impairing depth perception. In this paper, we propose Volumetric Depth Images (VDI) to overcome these issues for view-dependent volume visualization by an extension of the Layered Depth Image (LDI) approach. Instead of only saving for each view ray of one camera configuration the depth and color values for a set of surfaces, as in LDIs, VDIs store so- called supersegments, each consisting of a depth range as well as composited color and opacity.
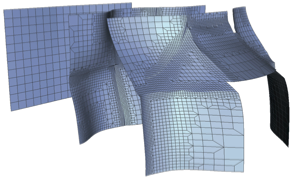
Mesh Generation From Layered Depth Images Using Isosurface Raycasting
S. Frey, F. Sadlo, and T. Ertl
ISVC 2013 - International Symposium on Visual Computing, Rethymnon, Crete, Greece, 2013.
This paper presents an approach for the fast generation of meshes from Layered Depth Images (LDI), a representation that is inde- pendent of the underlying data structure and widely used in image-based rendering. LDIs can be quickly generated from high-quality, yet compu- tationally expensive isosurface raycasters that are available for a wide range of different types of data. We propose a fast technique to extract meshes from one or several LDIs which can then be rendered for fast, yet high-quality analysis with comparatively low hardware requirements. To further improve quality, we also investigate mesh geometry merging and adaptive refinement, both for triangle and quad meshes.
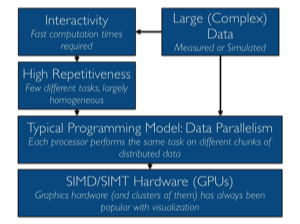
Parallel Interactive Visualization: Strategies and Examples
S. Frey and T. Ertl
Interaction and HPC: Multi-Scale / Multi-Physics Applications, ParCo 2013, Munich, Germany, 2013. (Talk Only)
Scientific visualization applications typically exhibit a common structure and share a number of characteristic properties and requirements in the context of parallel computation. We outline these aspects by means of several applications from our scientific visualization research. We further show that, despite these shared commonalities, there exists a variety of significantly different approaches to improve the responsiveness in the context of parallel and distributed hardware architectures. This is exemplified by means of several of our visualization research projects.
2012
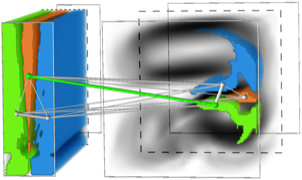
Visualization of Temporal Similarity in Field Data
S. Frey, F. Sadlo and T. Ertl
Large parts of science and engineering deal with time-dependent phenomena. We present an interactive visualization approach for detecting and exploring similarity in the temporal variation of field data. It allows the investigation of periodic and quasi-periodic behavior at single points as well as similarity between different locations within a field or between different data sets.
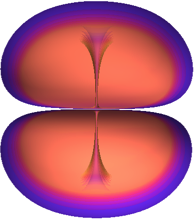
SIMT Microscheduling: Reducing Thread Stalling in Divergent Iterative Algorithms
S. Frey, G. Reina and T. Ertl
Current GPUs execute group of threads (warps) in lockstep. This potential leads to a large amount of wasted cycles for divergent control flow. To overcome this issue, we propose techniques to relax divergence on the fly within a computation kernel to achieve a much higher utilization of processing cores.
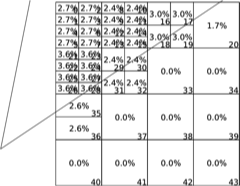
GPU-Accelerated Visualization
Ament, Marco; Frey, Steffen; Müller, Christoph; Grottel, Sebastian; Ertl, Thomas; Weiskopf, Daniel
In Book: E. W. Bethel, H. Childs, and C. Hansen: High Performance Visualization: Enabling Extreme-Scale Scientific Insight. Chapman and Hall/CRC (2012).
The book explores several distinct but interrelated approaches to high performance visualization. In my section, I give an overview on programming frameworks for GPU clusters with focus on visualization.
2011
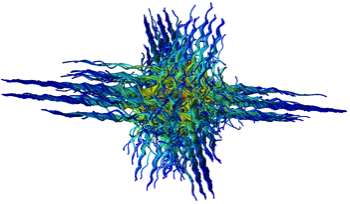
Loose Capacity-Constrained Representatives for the Qualitative Visual Analysis in Molecular Dynamics
S. Frey, T. Schlömer, S. Grottel, C. Dachsbacher, O. Deussen and T. Ertl
4th IEEE Pacific Visualization Symposium, Hong Kong, 2011.
The increasing extents of the spatial and temporal domain of molecular dynamics simulations pose a particular challenge for the visualization. Our technique replaces the huge amount of simulated particles by a smaller set of representatives that capture the characteristics of the underlying particle density and exhibit coherency over time.
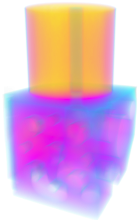
Load Balancing Utilizing Data Redundancy in Distributed Volume Rendering
S. Frey and T. Ertl
Eurographics 2011 Symposium on Parallel Graphics and Visualization (EGPGV'11), Bangor, Wales, 2011.
In distributed volume rendering, the cost for rendering different blocks of the volumes strongly varies with the camera configuration. Traditional load-balancing induces expensive data transfers. Our technique stores volume blocks redundantly, allowing our scheduler to evenly balance the load with almost no overhead.
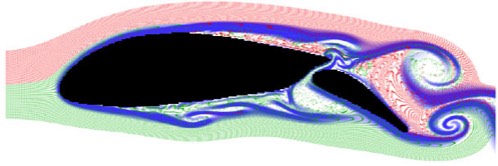
GPU-based 2D Flow Simulation Steering using Coherent Structures
M. Ament, S. Frey, F. Sadlo, T. Ertl and D. Weiskopf
Second International Conference on Parallel, Distributed, Grid and Cloud Computing for Engineering, Ajaccio, Corsica, France, 2011.
The interactive investigation of CFD flow can both allow to achieve a desired flow behavior faster and supports the understanding of underlying mechanisms. We propose a CUDA-based steering system that allows interactive manipulation of boundary conditions such as obstacles or velocity profiles.

DIANA: A Device Abstraction Framework for Parallel Computations
A. Panagiotidis, D. Kauker, S. Frey, T. Ertl
Second International Conference on Parallel, Distributed, Grid and Cloud Computing for Engineering, Ajaccio, Corsica, France, 2011.
There is a multitude of different APIs, SDKs and libraries for programming different many-core devices. DIANA provides a common interface to hide the complexity of managing them, allowing for easier maintainability, higher flexibility and improved portability.
2010
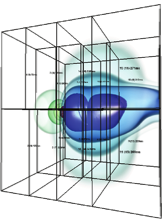
Interactive High-Quality Visualization of Higher-Order Finite Elements
M. Üffinger, S. Frey, and T. Ertl
Eurographics 2010 (EG'10), Norköpping, Sweden, 2010.
Higher-order finite element methods produce complex grids which feature non-convex, curvilinear cells with varying polynomial degree. We introduce a distributed GPU-based ray casting system employing both adaptive sampling and load-balancing for achieving interactive frame rates.
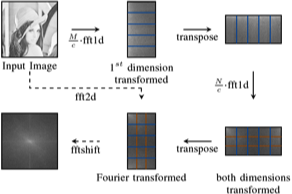
Memory Saving Fourier Transform on GPUs
D. Kauker, H. Sanftmann, S. Frey, and T. Ertl
Frontier of GPU Computing 2010 (FGC'10), Bradford, UK, 2010.
NVIDIA GPU Technology Conference (GTC'09), San Jose, USA, 2009.
NVIDIA GPU Technology Conference (GTC'09), San Jose, USA, 2009.
Current GPU Fourier transform libraries need a large buffer for storing intermediate results, severely limiting the size of an image that can be processed for instance. Our alternative two-dimensional Discrete Fourier Transform method computes the same output with far less memory by exploiting the separability property.
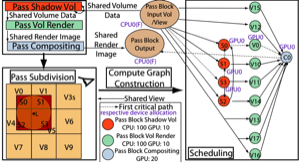
PaTraCo: A Framework Enabling the Transparent and Efficient Programming of Heterogeneous Compute Networks
S. Frey and T. Ertl
Eurographics 2010 Symposium on Parallel Graphics and Visualization (EGPGV'10), Norköpping, Sweden
In particular ad-hoc compute networks are typically heterogeneous, e.g. different classes of compute devices at different speeds suited for different kinds of tasks, varying network bandwidth). We propose a framework with a built-in scheduler that explicitly considers these characteristics and handles them transparently for the user.
2009
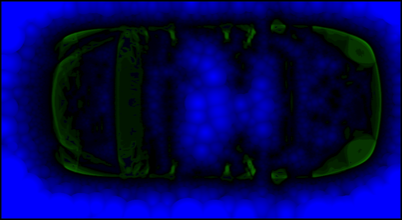
Accelerating Raycasting Utilizing Volume Segmentation of Industrial CT Data
S. Frey and T. Ertl
EG UK Theory and Practice of Computer Graphics (TPCG'09), Cardiff, Wales , 2008.
Raycasting large CT volumes interactively is still computationally demanding. Utilizing the segmentation information that is typically employed for object analysis, GPU ray casting can be accelerated significantly using a novel data structure that is integrated into the volume, requiring no extra texture lookups.
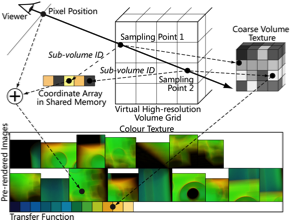
Concurrent CT Reconstruction and Visual Analysis Using Hybrid Multi-resolution Raycasting in a Cluster Environment
S. Frey, C. Müller, M. Strengert, and T. Ertl
5th International Symposium on Advances in Visual Computing (ISVC'09), Las Vegas, Nevada, 2009.
Preparing the data for analysis after the CT scanning of an object takes a considerable amount of time. Our distributed program architecture leverages all resources of a GPU cluster for the incremental reconstruction, segmentation and rendering, provide the user with continuously updated provisional results.
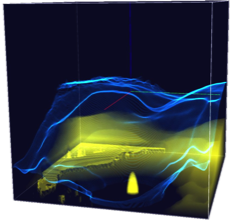
CUDA-Accelerated Continuous 2-D Scatterplots
S. Bachthaler, S. Frey and D. Weiskopf
IEEE Visualization 2009 (VIS'09), Poster, Atlantic City, USA, 2009.
Continuous scatterplots represent a continous distribution function in a dense way in the scatterplot domain. We significantly speed up the original CPU approach with our GPU implementation to allow for interactive exploration.
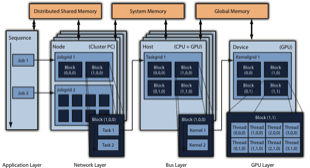
A Compute Unified System Architecture for Graphics Clusters Incorporating Data-Locality
C. Müller, S. Frey, M. Strengert, C. Dachsbacher and T. Ertl
CUDA is a parallel computing architecture for graphics cards. CUDASA logically extends its programming model and API for multi-GPU systems and distributed GPU computing. It includes an automatic GPU-accelerated scheduling mechanism that is aware of data locality to optimize GPU utilization.